INFO GRAPHICS WITH EXCEL

I’m not always the biggest fan of info graphics. Many of the posters-sized info graphics released these days have issues. But lately I’ve also received several requests on how to do info graphics with Excel. Many people don’t know where to start.

How Info Graphics are Different
Info graphics differ somewhat from your usual dashboard-style reporting. When we report with business tools, we use the data points–charts, tables, etc–to investigate a problem or monitor a system. That is, we use data to find results. Info graphics are used when we already know the results and we want to present it in an interesting, sometimes even artistic, way. Info graphics, then, are more about style and appearance–they wouldn’t necessarily find a good home on a dashboard. But they do work well in magazines, newspapers, and some student projects.

Info Graphics and Excel
Many info graphics are made with graphic editing programs like Adobe Illustrator. As far as I know, these illustrations are static. So each change in the underlying data won’t be automatically updated in the graphic. You would just have to redraw the graphic. Excel provides a benefit here: if we use Excel’s charts to make our info graphics, we can update the underlying data and the result appears automatically.

Read more at INFO GRAPHICS WITH EXCEL

Write your opinions about this article below and subscribe us for the latest article in your inbox.

What’s the Difference Between Business Intelligence (BI) and EPM?

Business Intelligence Emerges From Decision Support

Although there were some earlier usages, business intelligence (BI) as it’s understood today evolved from the decision support systems (DSS) used in the 1960s through the mid-1980s. Then in 1989, Howard Dresner (a former Gartner analyst) proposed “business intelligence” as an umbrella term to describe “concepts and methods to improve business decision-making by using fact-based support systems.” In fact, Mr. Dresner is often referred to as the “father of BI.” (I’m still trying to identify and locate the “mother of BI” to get the full story.)

The more modern definition provided by Wikipedia describes BI as “a set of techniques and tools for the acquisition and transformation of raw data into meaningful and useful information for business analysis purposes.” To put it more plainly, BI is mainly a set of tools or a platform focused on information delivery and typically driven by the information technology (IT) department. The term “business intelligence” is still used today, although it’s often paired with the term “business analytics,” which I’ll talk about in a minute.

Along Came Enterprise Performance Management

In the early 1990s, the term “business performance management” started to emerge and was strongly associated with the balanced scorecard methodology. The IT industry more readily embraced the concept around 2003, and this eventually morphed into the term “enterprise performance management” (EPM), which according to Gartner “is the process of monitoring performance across the enterprise with the goal of improving business performance.” The term is often used synonymously with corporate performance management (CPM), business performance management (BPM), and financial performance management (FPM).

Read more at What’s the Difference Between Business Intelligence (BI) and EPM?

Contact us if you have any questions or share it in the comment box below.

Why Supply Chains Need Business Intelligence

Companies that want to effectively manage their supply chain must invest in business intelligence (BI) software, according to a recent Aberdeen Group survey of supply chain professionals. Survey respondents reported the main issues that drive BI initiatives include increased global operations complexity; lack of visibility into the supply chain; a need to improve top-line revenue; and increased exposure to risk in the supply chain. Fluctuating fuel costs, import/export restrictions and challenges, and thin profit margins are driving the need for businesses to clearly understand all the factors that affect their bottom line.

Business Intelligence essentially means converting the sea of data into knowledge for effective business use. Organizations have huge operational data that can be used for trend analysis and business strategies. To operate more efficiently, increase revenues, and foster collaboration among trading partners companies should implement BI software that illuminates the meaning behind the data.

There is a vast amount of data to collect and track within a supply chain, such as transportation costs, repair costs, key performance indicators on suppliers and carriers, and maintenance trends. Being able to drill down into this information to perform analysis and observe historical trends gives companies the game-changing information they need to transform their business.

Read more at Why Supply Chains Need Business Intelligence

We welcome you to share your opinions and suggestions, and subscribe us to get more updates.

Bringing Elegance and Simplicity to Problem Solving and Enterprise Technology Adoption

There’s an old expression, “Don’t work harder; work smarter.” Old as it may be, this is one of the adages of New Purchasing: The answer to complexity does not have to be more complexity.

Is this not the reason for enterprise technology? Organizations adopt solutions that enable their employees to work more quickly, more efficiently and with better organization. Really, this is the same reason that many people adopt technology in their personal lives, as well.

If you’re looking to build a website, you no longer need to code everything from scratch. Instead, services from sources like Google and Homestead can do that for you. With Google Domains, you can easily find a domain and build a website for your business, while their innovation services provide developer tools, APIs and other resources for quickly adding novel features. Similarly, Homestead offers you the means to “Get a site. Get found. Get customers.”

Each of these solutions providers offers you a simple, elegant solution for what seems like a pretty daunting task. Wouldn’t you expect the same technology treatment for improving your enterprise procurement?

Just as building a website for a personal blog or corporate website has never been easier, the same is true for creating an online shopping site. Shopify’s solution can help you to create an online storefront for one product or millions – without needing any specific design skills. With a platform like Mobify, you can even extend that digital marketplace with mobile touch points.

Read more at Bringing Elegance and Simplicity to Problem Solving and Enterprise Technology Adoption

What do you think about this topic? Share your opinions with us in the comment box.

post

Supply Chain Management in QlikView / Qlik Sense

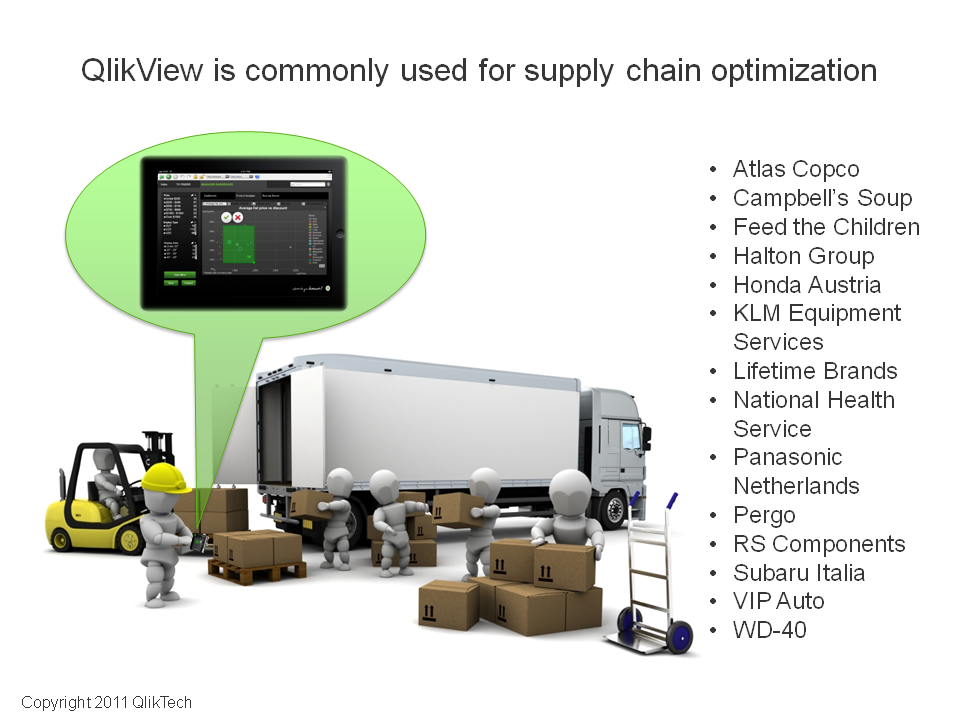
With complicated structure in a supply chain, it has been a challenge for executives to see and understand the associated changes and movements in a supply chain. Examples are raw materials, inventory, products, marketing campaigns, promotions, and other supply chain activities.

As brands and products proliferate, are spun off, and re-consolidated, supply chain companies find themselves struggling to understand what they have, what they need, and where they’re going. Doing so requires a tremendous amount of data, drawn from both external sources (suppliers, partners, customers) and internal ones (marketers, production managers, supply chain groups). The ability to see all of the data surrounding a brand at a glance is a tall order, one only made harder by the proliferation of systems and processes designed to support it. Before companies can profit from efficiencies of scale, they need to consolidate these systems. This is an area where business intelligence (BI) can help them.

However, melding disparate data sources through business intelligence turns out to be a disaster, when companies are using multiple technologies under one roof. These technologies could be from Microsoft, Oracle, SAP, IBM, Teradata, and others. People are struggling before BI implementation, and people are struggling even more after it. As a result, instead of placing information in the hands of the managers who needed it, they are now locked inside those data and technologies, where they could barely get to the real BI they desperately need. On the other hand, IT departments are struggling with questions like: “how many people I needed to build reports”, “how long it is going to build reports”, and “what those reports should look like”.

To meet the challenges of data and technologies, a possible solution is QlikView or Qlik Sense from Qlik. Compared to other BI vendors, the most unique feature of QlikView / Qlik Sense is that people don’t have to think about the joins of tables; people don’t even have to think about which tables to pull out of their ERP. The appliance just bolts onto the side and sucks the whole thing out. People, or even non-IT people, can spent a week extracting the relevant data tables from the central data warehouse, then loading them into QlikView / Qlik Sense as individual data sets — one for sales, one for materials management, and so forth. And, suddenly, they can gaze across a total landscape of its supply chain before drilling down by product or brand or segment or market — or any combination it liked.

With QlikView / Qlik Sense, companies can train or hire a handful of savvy managers who in time became the trainers for their respective divisions. When the need arises for a report, they’ll point you to an existing report or enhance it or build a new one if need be, if everyone agrees it’s the right thing to do. People are taking reports into their own hands and customizing them to suit their needs.

In addition to this special feature, people can also implement their supply chain management BI by using one of the following templates in Qlik Demo site:

  • Executive Insights
  • Production Insights
  • Forecasting and Planning
  • Sourcing and Supplier
  • Regulatory Compliance
  • IT Management
  • Warehousing and Distribution
  • Transportation and Logistics
  • Merchandise Management

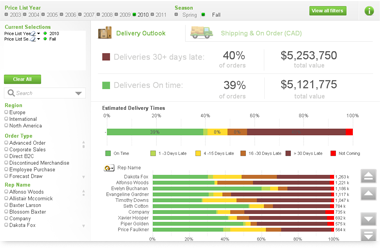
In addition, people can find other supply chain solutions provided by Qlik vendors at the Qlik Market. A screenshot of the Order and Inventory Management Dashboard is enclosed below. You can go to its interactive demo site here.

Order and Inventory Management.qvw

In summary, supply chain management is implemented in QlikView / Qlik Sense as applications or reports in all areas of the supply chain management, which can come from one of a reports template Qlik provides, custom made to match what you have today, or created by one of its vendors. The applications and reports do not need specialized IT departments to create and can be created by your very own people in the field.

References:


Regulate This! A New Freakonomics Radio Podcast

Regulate This! A New Freakonomics Radio Podcast

A battle is being waged between the Internet and the State, and this episode of Freakonomics Radio gives you front-row seats. It’s called “Regulate This!” (You can subscribe to the podcast at iTunes, get the RSS feed, or listen via the media player above. You can also read the transcript; it includes credits for the music you’ll hear in the episode.)

At issue is the so-called sharing economy, a range of services that facilitate peer-to-peer transactions through the Internet. Companies like Airbnb, Uber, and Lyft have seen rapid growth and eye-popping valuations, but as they expand around the world, they are increasingly butting heads with government regulators.

In this episode, you’ll hear from Nathan Blecharczyk, the co-founder and CTO of Airbnb (now valued at roughly $10 billion), and one of the youngest billionaires in the world. Blecharczyk tells Stephen Dubner the story of Airbnb’s founding, how it initially struggled to find investors, and what kind of obstacles it still faces daily. In New York City, for instance, it’s estimated that about two-thirds of its business activity is illegal. That’s a big concern for New York State Senator Liz Krueger, known as “Airbnb’s doubter-in-chief.”

Do you have any opinions about this topic? Share it in the comment.

Freakonomics Radio

Freakonomics Radio

In their books “Freakonomics,” “SuperFreakonomics,” and “Think Like a Freak,” Steven D. Levitt and Stephen J. Dubner explore “the hidden side of everything,” telling stories about cheating schoolteachers and eating champions while teaching us all to think a bit more creatively, rationally, and productively. The Freakonomics Radio podcast, hosted by Dubner, carries on that tradition with weekly episodes. Prepare to be enlightened, engaged, perhaps enraged, and definitely surprised.

What have you learnt from this podcast? Share in the comments if you have any opinions.

The Story Of Alibaba

The Story Of Alibaba

A massive Chinese company, Alibaba, is about to have what could be the biggest public offering on planet earth. You can think of Alibaba like Amazon or Ebay, except you can buy way more — you can get a used 747 airplane, or an oil tanker, or 500 million tiny screws. On the show, the company that made it possible for anyone anywhere to build almost anything they want. What that company means for China, for the rest of us and for some chickens in California.

If you have any opinions, please share with us in the comment.

The Difference Between Infographics, Instructographics and Data Visualisations

The Difference Between Infographics, Instructographics and Data Visualisations

Infographic is a well-known term in the marketing world, but what are data stories and instructographics? There is some debate about the differences between them all, especially when it comes to data stories, also known as data visualisations, and infographics. Whilst they hold some similarities, there are some key factors which make them quite distinct from each other.

What are infographics?

Infographics are created to tell a story about something. They can be about almost any topic, from how much plastic the world uses to what makes a successful mobile app; but they are always aimed at a specific audience. Essentially, if you have some interesting facts or data to share, infographics are the most accessible way to do it. They’re clear, look attractive and are therefore very shareable. Although your audience enjoys evergreens and blogs, remember that they often don’t have time to read the whole thing. An infographic provides a neat summary of the information they need to know, so they can be a welcome break from the walls of text they see all day, every day.

How do instructographics differ?

Instructographics usually cover a DIY task, but again, they can cover almost any topic. Just like an infographic, they have the potential to go viral and are made to look as attractive as possible. Although a well-written ‘how to’ guide can cover much more information than an instructographic, they often aren’t as visually appealing or easy to follow.

…and data visualisations?

Data visualisations are much like an unrefined infographic. They present quantifiable information and so are more likely to focus on numbers. In some cases, an entire data set is shown without editing and they rarely take a lot of handiwork to produce. They are much more likely to be generated by computer programs using algorithms, as their overall look isn’t too important.

Please leave comments below if you have opinions. You may also send us a message.


Why Most People’s Charts & Graphs Look Like Crap

Why Most People’s Charts & Graphs Look Like Crap

Data visualization is a powerful tool to communicate complex information in an engaging way. By visualizing information, our brains can synthesize and retain content more effectively, increasing its impact. But if data isn’t properly visualized, it can do more damage than good. The wrong presentation can diminish the data’s message or, worse, misrepresent it entirely.

Here are 10 data visualization mistakes you’re probably making and the quick fixes to remedy them.

1) Misordering Pie Segments

Pie charts are some of the most simple visualizations, but they are often over-complicated.

2) Using Non-Solid Lines in a Line Chart

Dashed and dotted lines can be distracting. Instead, use a solid line and colors that are easy to distinguish from each other.

3) Arranging Data Non-Intuitively

Your content should be presented in a logical and intuitive way to guide readers through the data. Order categories alphabetically, sequentially, or by value.

4) Obscuring Your Data

Make sure no data is lost or obstructed by design. For example, use transparency in a standard area chart to make sure the viewer can see all data.

5) Making the Reader Do More Work

Make it as easy as possible to understand data by aiding the reader with graphic elements. For example, add a trendline to a scatterplot to highlight trends.

6) Misrepresenting Data

Makes sure all representations are accurate. For example, bubbles should be scaled according to area, not diameter.

7) Using Different Colors on a Heat Map

Some colors stand out more than others, giving unnecessary weight to that data. Instead, use a single color with varying shades or a spectrum between two analogous colors to show intensity.

8) Making Bars Too Wide or Too Thin

It’s tempting to get creative with your presentation, but keeping things consistent helps your viewer. The space between bars in a bar chart should be ½ bar width.

9) Making it Hard to Compare Data

Comparison is a valuable way to showcase differences, but it’s useless if your viewer can’t easily compare.

10) Using 3D Charts

Though they may look exciting, 3D shapes can distort perception and therefore skew data. Stick with 2D shapes to ensure data is presented accurately.

What was your major problem in creating charts and graphs? How do you find this article? If it is useful, share it out so more people can learn from it. Leave comments or send us a messageif you have any suggestion or opinion.