8 Best Data Visualization Tools that Every Data Scientist Should Know

"A

Data scientists have to analyze, interpret, and visualize large datasets on a daily basis. This is why it is important for them to have the right data visualization tools at their disposal.
It can be difficult for people who don’t work closely with data every day (such as managers or executives) to grasp what they are trying to say if all they give them is words on paper or an Excel spreadsheet full of numbers without any context.
Data visualization tools allow data scientists to communicate their findings more effectively, which is important because it allows them to share their insights with other people who may not be familiar with data science concepts.

Best Data Visualization Tools for Every Data Scientist

In this article, we shall take a look at some of the best data visualization tools for data scientists and how they can effectively increase the efficiency of data scientists. Here are eight important data visualization tools to help data scientists make better-informed decisions.

1. Tableau

Tableau is a data visualization tool that can be used to create interactive graphs, charts, and maps. It allows you to connect to different data sources and create visualizations in minutes.
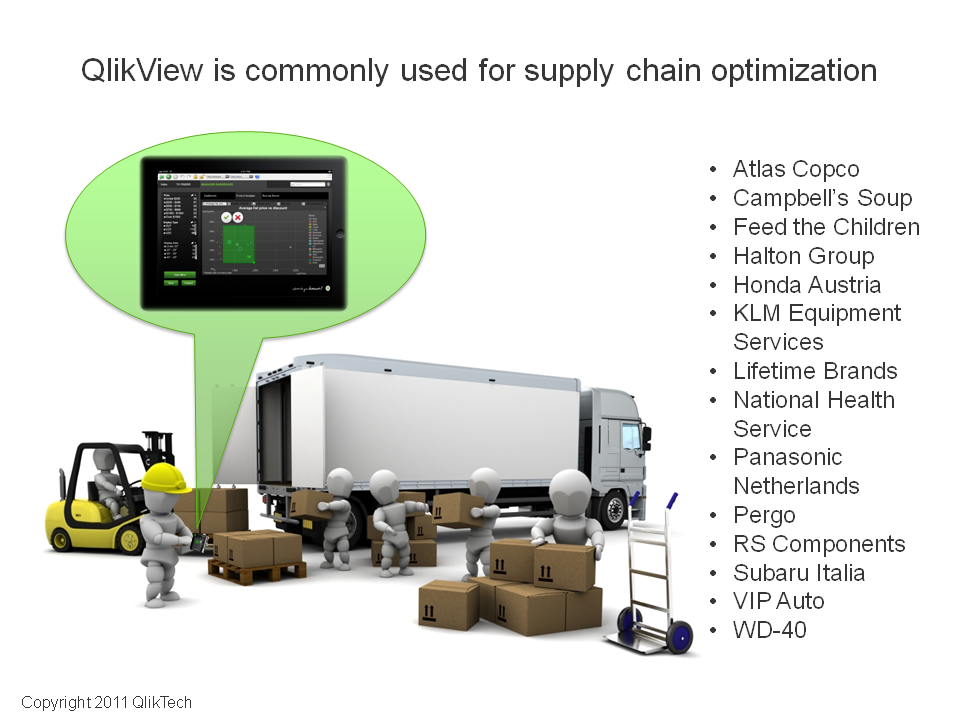
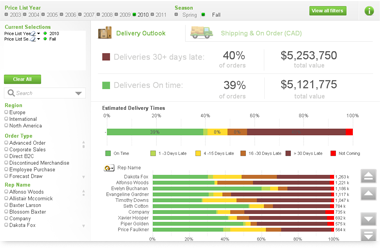
2. QlikView

QlikView is not just another data visualization tool, It is a data discovery platform that empowers the users to make faster, more informed decisions by accelerating analytics, revealing new business insights, and increasing the accuracy of results.

3. Microsoft Power BI

The Microsoft Power BI is the data visualization tool that is used for business intelligence type of data. It is and can be used for reporting, self-service analytics, and predictive analytics.

4. Datawrapper

Datawrapper is an online data visualization tool that can be used in various contexts. It is very easy to use, and it has a clean and intuitive user interface.

5. Plotly

Plotly is a data visualization tool that is used to create interactive graphs, charts, and maps. You can also use Plotly to create a visualization of a dataset, then share the link of that visualization with your readers on social media or on your blog.

6. Sisense

Sisense is a data visualization tool that allows you to easily create interactive visualizations from your data. With Sisense, you can quickly and easily create extensive, informative dashboards that will help you understand your data better.

7. Excel

Microsoft Excel is a data visualization tool that has an easy interface, so it doesn’t have to be difficult to work with.

8. Zoho analytics

Zoho Analytics is a data visualization and reporting tool that can help you to easily create custom reports and dashboards.

Conclusion

In the modern world, data is everywhere and it’s important for brands to be able to decode and communicate their message in an effective manner.
And for data scientists, learning and keeping up with all the latest data visualization tools is paramount, and only after they master this art, they can keep up with the pace of big data, and the fast-moving realms of AI and ML.

post

Supply Chain Management in QlikView / Qlik Sense

With complicated structure in a supply chain, it has been a challenge for executives to see and understand the associated changes and movements in a supply chain. Examples are raw materials, inventory, products, marketing campaigns, promotions, and other supply chain activities.

As brands and products proliferate, are spun off, and re-consolidated, supply chain companies find themselves struggling to understand what they have, what they need, and where they’re going. Doing so requires a tremendous amount of data, drawn from both external sources (suppliers, partners, customers) and internal ones (marketers, production managers, supply chain groups). The ability to see all of the data surrounding a brand at a glance is a tall order, one only made harder by the proliferation of systems and processes designed to support it. Before companies can profit from efficiencies of scale, they need to consolidate these systems. This is an area where business intelligence (BI) can help them.

However, melding disparate data sources through business intelligence turns out to be a disaster, when companies are using multiple technologies under one roof. These technologies could be from Microsoft, Oracle, SAP, IBM, Teradata, and others. People are struggling before BI implementation, and people are struggling even more after it. As a result, instead of placing information in the hands of the managers who needed it, they are now locked inside those data and technologies, where they could barely get to the real BI they desperately need. On the other hand, IT departments are struggling with questions like: “how many people I needed to build reports”, “how long it is going to build reports”, and “what those reports should look like”.

To meet the challenges of data and technologies, a possible solution is QlikView or Qlik Sense from Qlik. Compared to other BI vendors, the most unique feature of QlikView / Qlik Sense is that people don’t have to think about the joins of tables; people don’t even have to think about which tables to pull out of their ERP. The appliance just bolts onto the side and sucks the whole thing out. People, or even non-IT people, can spent a week extracting the relevant data tables from the central data warehouse, then loading them into QlikView / Qlik Sense as individual data sets — one for sales, one for materials management, and so forth. And, suddenly, they can gaze across a total landscape of its supply chain before drilling down by product or brand or segment or market — or any combination it liked.

With QlikView / Qlik Sense, companies can train or hire a handful of savvy managers who in time became the trainers for their respective divisions. When the need arises for a report, they’ll point you to an existing report or enhance it or build a new one if need be, if everyone agrees it’s the right thing to do. People are taking reports into their own hands and customizing them to suit their needs.

In addition to this special feature, people can also implement their supply chain management BI by using one of the following templates in Qlik Demo site:

  • Executive Insights
  • Production Insights
  • Forecasting and Planning
  • Sourcing and Supplier
  • Regulatory Compliance
  • IT Management
  • Warehousing and Distribution
  • Transportation and Logistics
  • Merchandise Management

In addition, people can find other supply chain solutions provided by Qlik vendors at the Qlik Market. A screenshot of the Order and Inventory Management Dashboard is enclosed below. You can go to its interactive demo site here.

Order and Inventory Management.qvw

In summary, supply chain management is implemented in QlikView / Qlik Sense as applications or reports in all areas of the supply chain management, which can come from one of a reports template Qlik provides, custom made to match what you have today, or created by one of its vendors. The applications and reports do not need specialized IT departments to create and can be created by your very own people in the field.

References:


Business Intelligence Barista: Mixing your choice of BI Coffee with Tableau, Power BI or Qlikview?

Business Intelligence Barista: Mixing your choice of BI Coffee with Tableau, Power BI or Qlikview?

Choosing a Business Intelligence is a bit like making coffee for the whole company. Everybody likes it their way, and they want it right now. Plus, everybody wants it differently. So, given that everyone has different requirements, how do you go about keeping everybody happy? If you think about how hard it is to keep everyone happy when you’re just making coffee, think how hard it is to select a business Intelligence solution. Not just any solution…. the *right* solution. 

So, given that everyone has different requirements, how do you go about keeping everybody happy? If you think about how hard it is to keep everyone happy when you’re just making coffee, think how hard it is to select a business Intelligence solution. Not just any solution…. the *right* solution. The one that will keep everyone happy and give them what they want. The solution that will keep the ambulance away from the door, where constraints must be met or there will be serious trouble. The solution that will keep everyone out of danger whilst making sure that the sprinkle lovers get their sprinkles, and the folks who like a chocolate covered spoon in their coffee get a little chocolate covered spoon – in milk, dark or white…

Hopefully this article could provide an insight for you to decide the best BI tools for you company. If you would like to know further, or if you have any question, please contact us or leave us comments below.

Dashboards Help CIOs Manage Business Services

CIO.com has recently released an article introducing the following 6 business dashboards by putting data from a variety of enterprise applications and services at a CIO’s fingertips so he or she can better manage employees, website activity, development projects and company resources.

Kapta Dashboard

Kapta shows a summary of employee goals in an easily identifiable red, yellow and green—map to the overall company goals with a heat map. The map shows a breakdown of the percentage completion rate by groups within IT.

Continue reading