April manufacturing output feels impact of COVID-19

While March began to show how the coronavirus, or COVID-19, began to truly impact the economy, things came into even starker perspective in April, based on data in the Institute for Supply Management’s (ISM) Manufacturing Report on Business, which was released today.

The report’s key metric—the PMI—at 41.5 (a reading of 50 or higher indicates growth)—declined 7.6% from March’s 41.5, falling for the second straight month, which was preceded by two months of growth. The April reading was 7.5% below the 12-month average of 49.0 and is also the lowest reading over the last 12 months and the lowest reading going back to April 2009’s 39.9. What’s more, ISM reported that April marked the first month that the overall economy contracted after a stretch of 131 consecutive months of economic expansion.

ISM reported that two of the 18 manufacturing sectors it tracks saw growth in April, including Paper Products; and Food, Beverage & Tobacco Products. And the 15 industries reporting contraction in April, in order, are: Printing & Related Support Activities; Furniture & Related Products; Transportation Equipment; Textile Mills; Fabricated Metal Products; Nonmetallic Mineral Products; Machinery; Plastics & Rubber Products; Electrical Equipment, Appliances & Components; Petroleum & Coal Products; Wood Products; Miscellaneous Manufacturing; Computer & Electronic Products; Primary Metals; and Chemical Products.

Each of the report’s key metrics saw declines in April.

New orders, which are commonly referred to as the engine that drives manufacturing, saw a steep 15.1% decline, to 27.1 after a 7.6% decline, to 42.2, in March. This marks the third straight month of declines and is the lowest reading for new orders since December 2008’s 25.9. ISM said that two industries—Food, Beverage & Tobacco products and Paper Products—saw growth in April, with the remaining 16 all seeing declines.

Production—at 27.1—was down 20.2%, contracting for the second straight month and is the lowest figure since numeric ISM Report On Business index records were first issued in January 1948, with the 20.2% decrease from March representing the largest one month decline going back to January 1984, when it was down 20.7%. ISM said that two manufacturing sectors—Paper Products and Food, Beverage & Tobacco products—grew in April.

Employment—at 27.5—was down 16.3% compared to March, falling for the ninth consecutive month, and is its lowest reading since June 1949’s 27.2 reading, and represents the largest one-month percentage-point decrease going back to January 1948, when ISM began keeping numeric records. ISM said that each of the top six manufacturing sectors saw employment contraction driven by the furloughs and layoffs, due to a lack of new orders, with social distancing mandates also factoring into the number.

April inventories—at 49.7—headed up 2.8%, while contracting at a slower rate for the 11th consecutive month. The report explained that inventory contraction slowed as was expected, due to supply chain disruptions and the lack of labor to convert material, with 10 manufacturing sectors reporting higher inventory readings in April.

Read more at April manufacturing output feels impact of COVID-19

Share your opinions with us in the comment box. Subscribe to us to get updates.

6 in 10 businesses experienced at least one supply chain disruption in Asia Pacific in 2016

One in four businesses exceed ‎US$1 million in losses, but almost half of survey respondents in Asia Pacific did not insure their losses.

Zurich Insurance has revealed the key Asia Pacific findings of the Business Continuity Institute (BCI) “Supply Chain Resilience Report 2016”. Despite six out of ten organisations experiencing at least one supply chain disruption during the past year, with one in four exceeding ‎US$1 million in losses, the report found that almost half of survey respondents in Asia Pacific did not insure their losses.

Partnering with BCI for the eighth year, the annual report is regarded as one of the most authoritative benchmark reports in this business area. The key findings for Asia Pacific (APAC) this year are:

  1. IT/Telecom outages was named as the number one cause of supply chain disruption
  2. One in four organisations experienced cumulative losses of over ‎US$1 million
  3. 46% of organisations do not insure their losses, meaning they bore the full brunt of the cost
  4. Only 30% of disruptions occur with an immediate supplier
  5. 48% responded that top management have made commitments to supply chain resilience

Read more 6 in 10 businesses experienced at least one supply chain disruption in Asia Pacific in 2016

Subscribe us to get updates in your inbox. If you have any opinions, please share it at the comment box below.

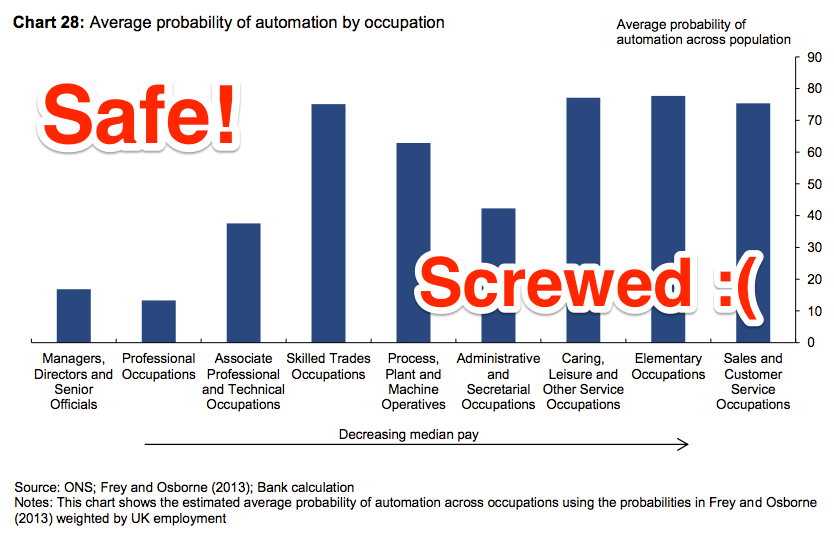
The Bank of England has a chart that shows whether a robot will take your job

robot jobs

The threat is real, as this chart showing the rise and fall of various jobs historically shows. Agricultural workers were replaced largely by machinery decades ago. Telephonists have only recently been replaced by software programmes. This looks like good news for accountants and hairdressers. Their unique skills are either enhanced by software (accountants) or not affected by it at all (hairdressers).

The BBC website contains a handy algorithm for calculating the probability of your job being robotised. For an accountant, the probability of vocational extinction is a whopping 95%. For a hairdresser, it is 33%. On these numbers, the accountant’s sun has truly set, but the relentless upwards ascent of the hairdresser is set to continue. For economists, like me, the magic number is 15%.

Another data analysis about jobs which will be phased out as time goes. It is an interesting analysis of historical job data. However, after I glanced through the bank report referenced in the article, I am not sure robots are the reason of the job replacement. For example, it could be replaced by cheap labor in foreign countries. The bank report shows only the jobs subject to be phased out due to technology advancement. People could just become productive. So, do not take robots too seriously!

Read more at The Bank of England has a chart that shows whether a robot will take your job

What do you think about this article? Share you opinions in the comment box and subscribe us to get updates.

Top 25 Risk Factors for Manufacturing Supply Chains

According to a recent report from BDO USA, an accounting and consulting organization, manufacturers’ intellectual property, supply chain data and products have become prime targets for cyber criminals.

The 2016 BDO Manufacturing RiskFactor Report examines the risk factors in the most recent 10-K filings of the largest 100 publicly traded U.S. manufacturers across five sectors including fabricated metal, food processing, machinery, plastics and rubber, and transportation equipment.

The factors were analyzed and ranked by order of frequency cited.

Manufacturing Industry Serves Up New Risks

The manufacturing industry is getting mixed reviews.

The Institute for Supply Management (ISM) Index reported that activity was up in April after five straight months of declines.

Then, in late May, the Purchasing Manager’s Index reported the first reduction in output since September 2009.

In the trenches, manufacturers say domestic demand has been solid, while global business has been more challenging. And the end customer matters: in a recent earnings call, Caterpillar’s CEO noted, “Just about any market that’s away from oil is doing pretty good.”

“Pretty good” is a modest but realistic goal for manufacturers this year, and their top concerns echo this cautious optimism. The annual analysis of the most frequently cited risk factors found the supply chain remains at the top of the list – cited by 100 percent of manufacturers we analyzed – while emerging and growing risks in cybersecurity, competition, labor, pricing, regulations and international operations are also keeping manufacturers up at night.

Read more at Top 25 Risk Factors for Manufacturing Supply Chains

Share your opinions about Risk Factors for Manufacturing Supply Chains with us in the comment box and subscribe us for updates.

Poor Visibility Puts a Majority of Organizations at Risk for Supply Chain Disruption

The majority of companies that experienced a supply chain disruption in the last year cited either a tier 1 or tier 2 supplier as the predominant source of the disruption, according to 2015 Supply Chain Resilience Report from the Business Continuity Institute and Zurich Insurance. Half of all respondents in the report cited a tier 1 supplier, the immediate or direct supplier, as the major source of the supply chain disruption and an additional 21% cited their tier 2 supplier, the supplier of the OEM’s tier 1 supplier.

The report also showed the majority (72%) of organizations lack full visibility into their supply chains. What is troublesome, too, is that nearly 1 in 10 (9%) of the more than 500 companies surveyed for the report do not fully know who their key suppliers are. This can no doubt make supply chain risk management even more difficult for firms that lack proper oversight on who exactly their suppliers are.

According to Thomas Kase, vice president of research at Spend Matters and an expert on supply chain risk, sometimes companies lack quality visibility and have a fragmented picture of their suppliers and what they deliver.
“The end result is a foggy mess,” Thomas said.

Read more at Poor Visibility Puts a Majority of Organizations at Risk for Supply Chain Disruption

Share your opinions with us about this topic and subscribe to get updates in your inbox.