Understanding COVID-19 and the vaccine cold chain

Understanding COVID-19 and the vaccine cold chain

Understanding COVID-19 and the vaccine cold chain

B Medical Systems discusses the importance of reliable, high quality bio-medical storage and the crucial impact of the vaccine cold chain.
Optimal cold chain infrastructures are vital if vaccines are to reach healthcare facilities at temperatures where their efficacy remains unchanged. The COVID-19 pandemic has not only highlighted the disparities in vaccine roll outs around the world but the logistical hurdles that can arise when transporting and storing medical equipment at ultra-low temperatures. B Medical Systems offers a range of cold chain solutions that can be used to store and transport vital vaccines, medicines and samples around the world. Here, they tell Health Europa Quarterly (HEQ) about some of the key challenges in the vaccine cold chain and how their over ­40 years in operation have helped them become a global leader in providing cutting-edge medical devices.

What sets B Medical Systems’ refrigeration units apart from similar products on the market?

The main factor that sets B Medical Systems apart from other manufacturers out there is our history as experts in the provision of cold chain solutions for vaccines. During our 40 plus years of operations, we have gone through all the ups and downs of the industry; testing our equipment in the most rugged territories in the world. Our main business is in the vaccine cold chain in Africa, South America and Southeast Asia and the experiences that we gained from those areas flow into every product that we have.

What key challenges have you experienced related to transporting vaccines in inhospitable regions?

The main challenge is logistics. Most people will have a refrigerator at home but there are a lot of areas and households in the world that do not have access to power, and the same is true of medical facilities. How do you get a vaccine that is produced with the highest standards in some Western countries – be it Germany, the US, or the UK – to areas without the necessary facilities to keep vaccines stable and stored correctly?

Aside from storing the COVID-19 vaccine, what are some other existing or potential applications for ultra-low temperature freezers?

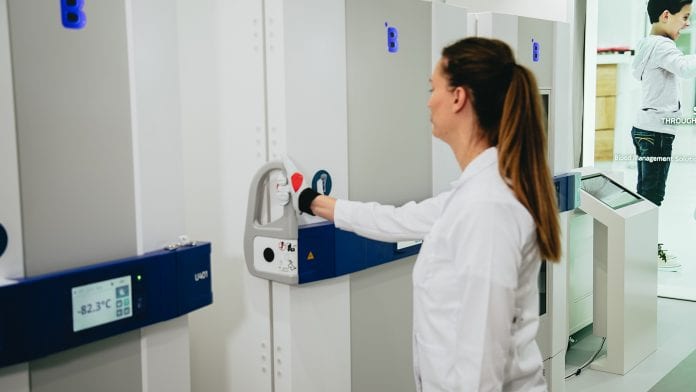
Any kind of current or future mRNA vaccine that needs or will need to be stored for a long period of time will require storage in an ULT freezer. This though would not be required for those vaccines that only need to be stored for up to two weeks, for instance, but certainly any biological specimen – human, animal and even plant specimens – that you want to store over a longer period need to be stored in an ULT.

Read more at Understanding COVID-19 and the vaccine cold chain

Share your comments and opinions with us, and subscribe us to get more updates.

How to Measure Supply Chain Performance

The appropriate metrics to manage and measure the success of a company’s operation vary significantly by industry, by individual company, and by the scale of the business. What does not vary, however, is the universal need of all companies to employ a well-structured, hierarchical framework to organize and manage their metrics.

The absence of a cohesive framework to house metrics greatly increases the likelihood that a company’s performance measurement system (PMS) will provide inadequate management support, and that resources will be wasted developing duplicative, unaligned and even conflicting metrics.

There are a number of well-known models and frameworks for operations, logistics and supply chain management. Two of the most prominent are the SCOR model and the Balanced Scorecard, and the interested reader is referred to these.

Figure 1 depicts an integrated hierarchical supply chain performance measurement system. The framework contains three levels (the strategic, tactical and operational), and within each level, it has both external and internal measures. In this PMS framework, it is the scale of an operation or activity that a particular metric monitors which determines its place in the hierarchy.

Figure 2 provides additional insight on how this hierarchical PMS framework works, displaying sample external and internal metrics for a distribution organization at each level of the hierarchy. The external metrics measure outputs and/or services that flow across the supply chain and evaluate some aspect of serving the customer. The internal metrics have an “inward” focus; and as shown in Figure 2, they evaluate how efficiently the overall distribution organization and each of its sub-functions operates.

Read more at How to Measure Supply Chain Performance

Leave your comments below and subscribe us to get updates by email.

INFO GRAPHICS WITH EXCEL

I’m not always the biggest fan of info graphics. Many of the posters-sized info graphics released these days have issues. But lately I’ve also received several requests on how to do info graphics with Excel. Many people don’t know where to start.

How Info Graphics are Different
Info graphics differ somewhat from your usual dashboard-style reporting. When we report with business tools, we use the data points–charts, tables, etc–to investigate a problem or monitor a system. That is, we use data to find results. Info graphics are used when we already know the results and we want to present it in an interesting, sometimes even artistic, way. Info graphics, then, are more about style and appearance–they wouldn’t necessarily find a good home on a dashboard. But they do work well in magazines, newspapers, and some student projects.

Info Graphics and Excel
Many info graphics are made with graphic editing programs like Adobe Illustrator. As far as I know, these illustrations are static. So each change in the underlying data won’t be automatically updated in the graphic. You would just have to redraw the graphic. Excel provides a benefit here: if we use Excel’s charts to make our info graphics, we can update the underlying data and the result appears automatically.

Read more at INFO GRAPHICS WITH EXCEL

Write your opinions about this article below and subscribe us for the latest article in your inbox.

Automating Big-Data Analysis and Replacing Human Intuition with Algorithms

Big-data analysis consists of searching for buried patterns that have some kind of predictive power.

But choosing which “features” of the data to analyze usually requires some human intuition.

In a database containing, say, the beginning and end dates of various sales promotions and weekly profits, the crucial data may not be the dates themselves but the spans between them, or not the total profits but the averages across those spans.

MIT researchers aim to take the human element out of big-data analysis, with a new system that not only searches for patterns but designs the feature set, too.

To test the first prototype of their system, they enrolled it in three data science competitions, in which it competed against human teams to find predictive patterns in unfamiliar data sets.

Of the 906 teams participating in the three competitions, the researchers’ “Data Science Machine” finished ahead of 615.

In two of the three competitions, the predictions made by the Data Science Machine were 94 percent and 96 percent as accurate as the winning submissions.

In the third, the figure was a more modest 87 percent. But where the teams of humans typically labored over their prediction algorithms for months, the Data Science Machine took somewhere between two and 12 hours to produce each of its entries.

“We view the Data Science Machine as a natural complement to human intelligence,” says James Max Kanter, whose MIT master’s thesis in computer science is the basis of the Data Science Machine.

Read more at Automating Big-Data Analysis and Replacing Human Intuition with Algorithms

What do you think about this article? Share your opinions with us in the comment box and subscribe us to get updates.

The Future Of Performance Management Is Not One-Size-Fits-All

In 2013, CEB research found that 86% of organizations had recently made significant changes to their performance management system, or were planning to. In 2014, a Deloitte survey found that 58% percent of companies surveyed did not think performance management was an effective use of time, and many media outlets jumped on the opportunity to air their grievances.

Finally, the rising wave of discontent seemed to crash in 2015, as a slew of large organizations like GE, Accenture, Netflix, and Adobe all scrapped their age-old annual performance management processes in favor of more continuous feedback systems. And many others followed suit.

But, was it the right move for everyone?

Last summer, I wrote an article on this topic myself, urging business leaders to really consider the implications of following these organizations. The issue, in my opinion, is not that these organizations did something wrong. Rather, the risk is that many leaders misinterpreted these stories to mean that they should abandon performance management altogether.

One thing is clear: the future of performance management in the American workplace is still very much in question.

For more insight into this important topic, I recently sat down with a handful of thought leaders in the performance management space, including Rob Ollander-Krane, Senior Director of Organizational Performance Effectiveness at Gap, Inc., Nigel Adams, Global Chief Talent Officer at Razorfish Global, and Amy Herrbold, Senior Director of Organizational Development at Kellogg. Together, we discussed the future of performance management to understand, from their perspective, why changes to this process are long overdue.

Read more at The Future Of Performance Management Is Not One-Size-Fits-All

Write your opinions in the comment box below and subscribe us to get updates in your inbox.

Automating Big-Data Analysis and Replacing Human Intuition with Algorithms

A new and unique computer system from MIT has outperformed human intuition using its algorithms, and it’s amazing, and perhaps a little frightening: the Data Science Machine beat out over 600 human teams in finding predictive analysis.

Big-data analysis consists of searching for buried patterns that have some kind of predictive power.

But choosing which “features” of the data to analyze usually requires some human intuition.

In a database containing, say, the beginning and end dates of various sales promotions and weekly profits, the crucial data may not be the dates themselves but the spans between them, or not the total profits but the averages across those spans.

MIT researchers aim to take the human element out of big-data analysis, with a new system that not only searches for patterns but designs the feature set, too.

To test the first prototype of their system, they enrolled it in three data science competitions, in which it competed against human teams to find predictive patterns in unfamiliar data sets.

Of the 906 teams participating in the three competitions, the researchers’ “Data Science Machine” finished ahead of 615.

In two of the three competitions, the predictions made by the Data Science Machine were 94 percent and 96 percent as accurate as the winning submissions.

In the third, the figure was a more modest 87 percent. But where the teams of humans typically labored over their prediction algorithms for months, the Data Science Machine took somewhere between two and 12 hours to produce each of its entries.

Read more at Automating Big-Data Analysis and Replacing Human Intuition with Algorithms

Share your opinions with us in the comment box. Subscribe to get updates in your inbox.

Close the Loop on Supply Chain Risk: 5 Strategies to Move Product, Boost Sales and Automate Efficiency

Supply chain management is a critical function for any small to mid-sized business. Yet, too often companies rely on spreadsheets to manage supply chain activities — a risky prospect that’s labor-intensive and error-prone.

A better option is to bring these activities into your financial management or ERP system. Centralizing tasks such as order filling, inventory management and delivery tracking can positively impact sales, improve cash flow and keep you tax compliant.

Here are five ways that ERP supply chain management benefits your bottom line.

Right-sized Inventory

Getting inventory right can be tricky: too low, you risk losing customers; too high and you’re left holding the bag, so to speak.

Control Quality

Dealing with defective materials or products can be a drain on your business. Not only can it hurt sales, but it can also damage your reputation.

Optimize Shipping

Web sales have made fast, affordable shipping a must-do for all businesses. Keeping track of goods coming and going can become burdensome, not to mention the hassle of dealing with lost or late shipments.

Improve Cash Flow

Invoicing practices can greatly impact your cash flow. Moving from a manual process to automation allows you to process invoices faster and shorten the order-to-cash cycle.

Be Compliant

Navigating complex and ever-changing trade and tax rules can be daunting. Being part of a supply chain compounds that risk.


Read more at Close the Loop on Supply Chain Risk: 5 Strategies to Move Product, Boost Sales and Automate Efficiency

Let us know what you think about this article. Subscribe to get updates in your inbox.