The Analytics Supply Chain

Businesses across many industries spend millions of dollars employing advanced analytics to manage and improve their supply chains. Organizations look to analytics to help with sourcing raw materials more efficiently, improving manufacturing productivity, optimizing inventory, minimizing distribution cost, and other related objectives.

But the results can be less than satisfactory. It often takes too long to source the data, build the models, and deliver the analytics-based solutions to the multitude of decision makers in an organization. Sometimes key steps in the process are omitted completely. In other words, the solution for improving the supply chain, i.e. advanced analytics, suffers from the same problems that it aims to solve. Therefore, reducing inefficiencies in the analytics supply chain should be a critical component of any analytics initiative in order to generate better outcomes. Because one of us (Zahir) spent twenty years optimizing supply chains with analytics at transportation companies, the concept was a naturally appealing one for us to take a closer look at.

More broadly speaking, the concept of the analytics supply chain is applicable outside of its namesake business domain. It is agnostic to business and analytic domains. Advanced analytics for marketing offers, credit decisions, pricing decisions, or a multitude of other areas could benefit from the analytics supply chain metaphor.

Read more at The Analytics Supply Chain

Please leave your opinions in the comment box below and subscribe us to get more updates in your inbox.

Socialbakers bakes its data analytics down to a Social Health Index

Can social media analytics be compressed into an elevator pitch?

That was a question Lenovo asked its social analytics firm, Socialbakers. The result, launching today, is a Social Health Index that presents a few top-level indicators of a brand’s standing in social media vis-a-vis any competitors.

“When you’re with a VP, you have to [quickly] give them a very clear idea of where we stand,” Lenovo’s director of the Digital and Social Center of Excellence Rod Strother told us. Given that need, Lenovo then provided input to Socialbakers for developing the Index.

It offers a single top-level number on a 100-point scale, as well as single numbers representing the client’s — or a competitor’s — social health on Facebook, Twitter, or YouTube. Other platforms will be added at some point, the social analytics firm said.

Additionally, an area graph visually depicts the four groups of data that go into the scores — participation, follower/fan/subscriber acquisition and retention, and shareability.

“We find it’s difficult for clients to comprehend all” the statistics in ordinary social analytics reports, Socialbakers’ CEO and co-founder Jan Rezab told VentureBeat.

“It’s very, very complicated,” he said, noting that his firm tracks over 180 metrics for social media.

Read more at Socialbakers bakes its data analytics down to a Social Health Index

Share your opinions with us in the comment box. Subscribe to get updates in your inbox.

The Bank of England has a chart that shows whether a robot will take your job

robot jobs

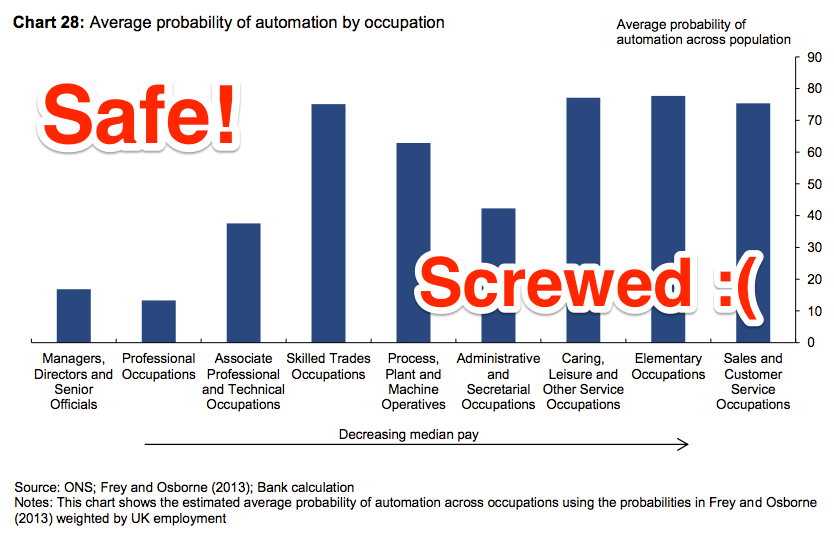
The threat is real, as this chart showing the rise and fall of various jobs historically shows. Agricultural workers were replaced largely by machinery decades ago. Telephonists have only recently been replaced by software programmes. This looks like good news for accountants and hairdressers. Their unique skills are either enhanced by software (accountants) or not affected by it at all (hairdressers).

The BBC website contains a handy algorithm for calculating the probability of your job being robotised. For an accountant, the probability of vocational extinction is a whopping 95%. For a hairdresser, it is 33%. On these numbers, the accountant’s sun has truly set, but the relentless upwards ascent of the hairdresser is set to continue. For economists, like me, the magic number is 15%.

Another data analysis about jobs which will be phased out as time goes. It is an interesting analysis of historical job data. However, after I glanced through the bank report referenced in the article, I am not sure robots are the reason of the job replacement. For example, it could be replaced by cheap labor in foreign countries. The bank report shows only the jobs subject to be phased out due to technology advancement. People could just become productive. So, do not take robots too seriously!

Read more at The Bank of England has a chart that shows whether a robot will take your job

What do you think about this article? Share you opinions in the comment box and subscribe us to get updates.

Big data analytics technology: disruptive and important?

Of all the disruptive technologies we track, big data analytics is the biggest. It’s also among the haziest in terms of what it really means to supply chain. In fact, its importance seems more to reflect the assumed convergence of trends for massively increasing amounts of data and ever faster analytical methods for crunching that data. In other words, the 81percent of all supply chain executives surveyed who say big data analytics is ‘disruptive and important’ are likely just assuming it’s big rather than knowing first-hand.

Does this mean we’re all being fooled? Not at all. In fact, the analogy of eating an elephant is probably fair since there are at least two things we can count on: we can’t swallow it all in one bite, and no matter where we start, we’ll be eating for a long time.

So, dig in!

Getting better at everything

Searching SCM World’s content library for ‘big data analytics’ turns up more than 1,200 citations. The first screen alone includes examples for spend analytics, customer service performance, manufacturing variability, logistics optimisation, consumer demand forecasting and supply chain risk management.

Read more at Big data analytics technology: disruptive and important?

Share your opinions regarding this topic in the comment box below and subscribe us for more updates.

Data Lake vs Data Warehouse: Key Differences

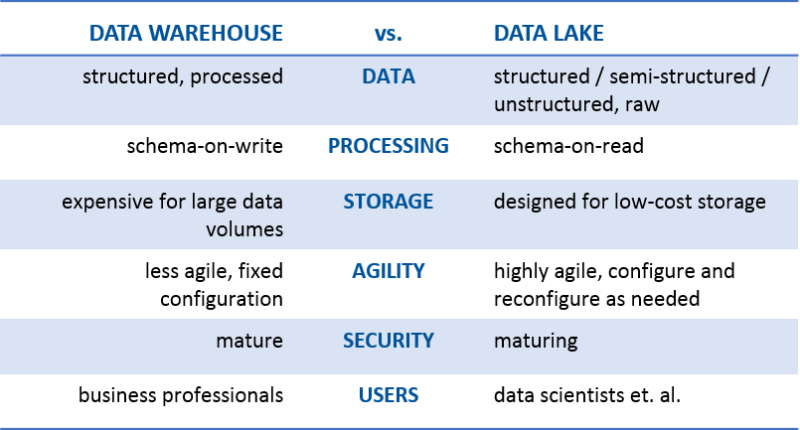
Some of us have been hearing more about the data lake, especially during the last six months. There are those that tell us the data lake is just a reincarnation of the data warehouse—in the spirit of “been there, done that.” Others have focused on how much better this “shiny, new” data lake is, while others are standing on the shoreline screaming, “Don’t go in! It’s not a lake—it’s a swamp!”

All kidding aside, the commonality I see between the two is that they are both data storage repositories. That’s it. But I’m getting ahead of myself. Let’s first define data lake to make sure we’re all on the same page. James Dixon, the founder and CTO of Pentaho, has been credited with coming up with the term. This is how he describes a data lake:

“If you think of a datamart as a store of bottled water – cleansed and packaged and structured for easy consumption – the data lake is a large body of water in a more natural state. The contents of the data lake stream in from a source to fill the lake, and various users of the lake can come to examine, dive in, or take samples.”

And earlier this year, my colleague, Anne Buff, and I participated in an online debate about the data lake. My rally cry was #GOdatalakeGO, while Anne insisted on #NOdatalakeNO. Here’s the definition we used during our debate:

“A data lake is a storage repository that holds a vast amount of raw data in its native format, including structured, semi-structured, and unstructured data. The data structure and requirements are not defined until the data is needed.”

Read more Data Lake vs Data Warehouse: Key Differences

What do you think about this topic? Share your opinions below and subscribe us to get updates in your inbox.


Supply Chain & Big Data ÷ Analytics = Innovation

Google the term “advanced analytics” and you get back nearly 23 million results in less than a second.

Clearly, the use of advanced analytics is one of the hottest topics in the business press these days and is certainly top of mind among supply chain managers.

Yet, not everyone is in agreement as to just what the term means or how to deploy advanced analytics to maximum advantage.

At HP, the Strategic Planning and Modeling team has been utilizing advanced operational analytics for some 30 years to solve business problems requiring innovative approaches.

Over that time, the team has developed significant supply chain innovations such as postponement and award winning approaches to product design and product portfolio management.

Based on conversations we have with colleagues, business partners and customers at HP, three questions come up regularly – all of which this article will seek to address.

  1. What is the difference between advanced and commodity analytics?
  2. How do I drive innovation with advanced analytics?
  3. How do I set up an advanced analytics team and get started using it in my supply chain?

Advanced analytics vs. commodity analytics

So, what exactly is the difference between advanced analytics and commodity analytics? According to Bill Franks, author of “Taming The Big Data Tidal Wave,” the aim of commodity analytics is “to improve over where you’d end up without any model at all, a commodity modeling process stops when something good enough is found.”

Another definition of commodity analytics is “that which can be done with commonly available tools without any specialized knowledge of data analytics.”

The vast majority of what is being done in Excel spreadsheets throughout the analytics realm is commodity analytics.

Read more at Supply Chain & Big Data ÷ Analytics = Innovation

What do you think about this topic? Write down your opinions in the comment box below, and subscribe us to get updates in your inbox.

Overcoming 5 Major Supply Chain Challenges with Big Data Analytics

Big data analytics can help increase visibility and provide deeper insights into the supply chain. Leveraging big data, supply chain organizations can improve the way they respond to volatile demand or supply chain risk–and reduce concerns related to the issues.

Sixty-four percent of supply chain executives consider big data analytics a disruptive and important technology, setting the foundation for long-term change management in their organizations (Source: SCM World). Ninety-seven percent of supply chain executives report having an understanding of how big data analytics can benefit their supply chain. But, only 17 percent report having already implemented analytics in one or more supply chain functions (Source: Accenture).

Even if your organization is among the 83 percent who have yet to leverage big data analytics for supply chain management, you’re probably at least aware that mastering big data analytics will be a key enabler for supply chain and procurement executives in the years to come.

Big data enables you to quickly model massive volumes of structured and unstructured data from multiple sources. For supply chain management, this can help increase visibility and provide deeper insights into the entire supply chain. Leveraging big data, your supply chain organizations can improve your response to volatile demand or supply chain risk, for example, and reduce the concerns related to the issue at hand. It will also be crucial for you to evolve your role from transactional facilitator to trusted business advisor.

Read more at Overcoming 5 Major Supply Chain Challenges with Big Data Analytics

What do you think about this article? Share your opinions with us in the comment box.

How Big Data And Analytics Are Transforming Supply Chain Management

Supply chain management is a field where Big Data and analytics have obvious applications. Until recently, however, businesses have been less quick to implement big data analytics in supply chain management than in other areas of operation such as marketing or manufacturing.

Of course supply chains have for a long time now been driven by statistics and quantifiable performance indicators. But the sort of analytics which are really revolutionizing industry today – real time analytics of huge, rapidly growing and very messy unstructured datasets – were largely absent.

This was clearly a situation that couldn’t last. Many factors can clearly impact on supply chain management – from weather to the condition of vehicles and machinery, and so recently executives in the field have thought long and hard about how this could be harnessed to drive efficiencies.

In 2013 the Journal of Business Logistics published a white paper calling for “crucial” research into the possible applications of Big Data within supply chain management. Since then, significant steps have been taken, and it now appears many of the concepts are being embraced wholeheartedly.

Applications for analysis of unstructured data has already been found in inventory management, forecasting, and transportation logistics. In warehouses, digital cameras are routinely used to monitor stock levels and the messy, unstructured data provides alerts when restocking is needed.

Read more at How Big Data And Analytics Are Transforming Supply Chain Management

Automating Big-Data Analysis and Replacing Human Intuition with Algorithms

Big-data analysis consists of searching for buried patterns that have some kind of predictive power.

But choosing which “features” of the data to analyze usually requires some human intuition.

In a database containing, say, the beginning and end dates of various sales promotions and weekly profits, the crucial data may not be the dates themselves but the spans between them, or not the total profits but the averages across those spans.

MIT researchers aim to take the human element out of big-data analysis, with a new system that not only searches for patterns but designs the feature set, too.

To test the first prototype of their system, they enrolled it in three data science competitions, in which it competed against human teams to find predictive patterns in unfamiliar data sets.

Of the 906 teams participating in the three competitions, the researchers’ “Data Science Machine” finished ahead of 615.

In two of the three competitions, the predictions made by the Data Science Machine were 94 percent and 96 percent as accurate as the winning submissions.

In the third, the figure was a more modest 87 percent. But where the teams of humans typically labored over their prediction algorithms for months, the Data Science Machine took somewhere between two and 12 hours to produce each of its entries.

“We view the Data Science Machine as a natural complement to human intelligence,” says James Max Kanter, whose MIT master’s thesis in computer science is the basis of the Data Science Machine.

Read more at Automating Big-Data Analysis and Replacing Human Intuition with Algorithms

What do you think about this article? Share your opinions with us in the comment box and subscribe us to get updates.

The Key to Analytics: Ask the Right Questions

People think analytics is about getting the right answers. In truth, it’s about asking the right questions.

Analysts can find the answer to just about any question. So, the difference between a good analyst and a mediocre one is the questions they choose to ask. The best questions test long-held assumptions about what makes the business tick. The answers to these questions drive concrete changes to processes, resulting in lower costs, higher revenue, or better customer service.

Often, the obvious metrics don’t correlate with sought-after results, so it’s a waste of time focusing on them, says Ken Rudin, general manager of analytics at Zynga and a keynote speaker at TDWI’s upcoming BI Executive Summit in San Diego on August 16-18.

Challenge Assumptions

For instance, many companies evaluate the effectiveness of their Web sites by calculating the number of page hits. Although a standard Web metric, total page hits often doesn’t correlate with higher profits, revenues, registrations, or other business objectives. So, it’s important to dig deeper, to challenge assumptions rather than take them at face value. For example, a better Web metric might be the number of hits that come from referral sites (versus search engines) or time spent on the Web site or time spent on specific pages.

TDWI Example. Here’s another example closer to home. TDWI always mails conference brochures 12 weeks before an event. Why? No one really knows; that’s how it’s always been done. Ideally, we should conduct periodic experiments. Before one event, we should send a small set of brochures 11 weeks beforehand and another small set 13 weeks prior. And while we’re at it, we should test the impact of direct mail versus electronic delivery on response rates.

Read more at The Key to Analytics: Ask the Right Questions