New Approaches to Analytics to Revolutionize Logistics

New Approaches to Analytics to Revolutionize Logistics

Three stages are commonly used to categorize an organizations maturity in their use of business intelligence and analytics technologies:

  1. Descriptive: What happened in the past?
  2. Predictive: What will (probably) happen in the future?
  3. Prescriptive: What should we do to change the future?

Descriptive analytics typically means good old fashioned business intelligence (BI) – reports and dashboards.  But, there is a newish technology in the Descriptive category – one that I might argue is worthy of a category in its own right.  That technology is visual data discovery.  The visual data discovery approach has a rapidly growing fan base for many reasons, but one stands out:  It increases the probability that business managers will find the information they need in time to influence their decisions.

Visual data discovery tools typically provide:

  1. Unrestricted navigation through, and exploration of, data.
  2. Rich data visualization so that information can be comprehended rapidly.
  3. The ability to introduce new data sources into an analysis to expand it further.

By helping to answer a different class of question – the unanticipated one – visual data discovery tools increase the probability that managers will find the information they need in time to influence their decisions.  And that, after all, is the only valid reason for investing in business intelligence solutions.

If you have any opinions, you are welcome to leave a comment or send us message.

Bywaters waste management uses BI to improve customers’ recycling

Bywaters waste management uses BI to improve customers’ recycling

Bywaters, a recycling and waste management company, has improved productivity by 4% using Pentaho data integration and business intelligence software.

Sasha Korniak, head of analytics and data science at Bywaters, masterminded the project at the family-owned company, which operates nationally, and includes Nandos, Guy’s and St. Thomas’ Hospital, and BNP Paribas among its 2,000-plus customers.

“I wanted Bywaters to embrace a data-driven culture that would give authority and confidence to make autonomous decisions substantiated by credible data and enable consumers to increase recycling and sustainability,” says Korniak.

“We are no longer just a waste management company, we are a waste consultancy, improving our customers’ recycling through providing the data”, says Korniak. “If you are not data driven, but just go out and collect bins, the sustainability of your business will be damaged”.

If you have any opinions, leave a comment below or send us a message.

Part-Time Entrepreneurs Need to Be Empowered

Part-Time Entrepreneurs Need to Be Empowered

According to Industry Canada, survival rates for small and medium-sized businesses decline over time. About 85 per cent of businesses that enter the marketplace survive for one full year yet only 51 per cent survive for five years.

Yet, with commitment and passion, many have successfully made the transition from part-time start-up to full-time career.

The Intuit survey found that about one third (35 per cent) of start-ups trying to go full-time would quit their jobs if they could pull in a mere $30,000 or less. Depending on your financial goals, taking your business full-time could be closer than you think.

Are you ready to make your dream a full-time career? Here are some tips to help you take it to the next level:

  1. Define a goal and build on it
  2. Continue to innovate
  3. Brush up on your financial literacy
  4. Make your network work for you
  5. Take advantage of free services

Share your thoughts about this by leaving comments below or feel free to send us a message.

A Harvest of Company Details, All in One Basket

A Harvest of Company Details, All in One Basket

Trolling government records for juicy details about companies and their executives can be a ponderous task. I often find myself querying the websites of multiple federal agencies, each using its own particular terminology and data forms, just for a glimpse of one company’s business.

But a few new services aim to reduce that friction not just for reporters, but also for investors and companies that might use the information in making business decisions. One site, rankandfiled.com, is designed to make company filings with the Securities and Exchange Commission more intelligible. It also offers visitors an instant snapshot of industry relationships, in a multicolored “influence” graph that charts the various companies in which a business’s officers and directors own shares. According to the site, pooh-bahs at Google, for example, have held shares in Apple, Netflix, LinkedIn, Zynga, Cisco, Amazon and Pixar.

Another site, Enigma.io, has obtained, standardized and collated thousands of data sets — including information on companies’ lobbying activities and their contributions to state election campaigns — made public by federal and state agencies. Starting this weekend, the public will be able to use it, at no charge, to seek information about a single company across dozens of government sources at once.

Welcome to leave any comment below or send us a message

Why Google Flu is a failure: the hubris of big data

Why Google Flu is a failure: the hubris of big data

People with the flu (the influenza virus, that is) will probably go online to find out how to treat it, or to search for other information about the flu. So Google decided to track such behavior, hoping it might be able to predict flu outbreaks even faster than traditional health authorities such as the Centers for Disease Control (CDC).

Instead, as the authors of a new article in Science explain, we got “big data hubris.” David Lazer and colleagues explain that:
“Big data hubris” is the often implicit assumption that big data are a substitute for, rather than a supplement to, traditional data collection and analysis.

The problem is that most people don’t know what “the flu” is, and relying on Google searches by people who may be utterly ignorant about the flu does not produce useful information. Or to put it another way, a huge collection of misinformation cannot produce a small gem of true information. Like it or not, a big pile of dreck can only produce more dreck. GIGO, as they say.

Google’s scientist first announced Google Flu in a Nature article in 2009. With what now seems to be a textbook definition of hubris, they wrote:
“…we can accurately estimate the current level of weekly influenza activity in each region of the United States, with a reporting lag of about one day.”

If you have any opinion, feel free to send us a messageor leave your comment below.


KB – Neural Data Mining with Python sources

KB – Neural Data Mining with Python sources

The aim of this book is to present and describe in detail the algorithms to extract the knowledge hidden inside data using Python language, which allows us to read and easily understand the nature and the characteristics of the rules of the computing utilized, as opposed to what happens in commercial applications, which are available only in the form of running codes, which remain impossible to modify.

The algorithms of computing contained within the book are minutely described, documented and available in the Python source format, and serve to extract the hidden knowledge within the data whether they are textual or numerical kinds. There are also various examples of usage, underlining the characteristics, method of execution and providing comments on the obtained results.

You are welcome to share your opinion in the comment box below or send us a message.

The Startup Entrepreneur’s Guide To Risk Management

The Startup Entrepreneur’s Guide To Risk Management

Only 44% of small businesses stick around four years or more. One big reason so many go away: Poor risk management.

Fortunately, help is on the way from the guys at VC Experts (subscribe to their email here).

They’ve published a helpful how-to on the art of risk management from Akira Hirai, the founder and managing director of Cayenne Consulting. With permission, we’ve excerpted the best bits below.

The Risk Management Framework

“Risk Management” is the art and science of thinking about what could go wrong, and what should be done to mitigate those risks in a cost-effective manner.

In order to identify risks and figure out how best to mitigate them, we first need a framework for classifying risks.

Once we know the severity and likelihood of a given risk, we can answer the question: Does the benefit of mitigating a risk outweigh the cost of doing so?

  1. Quadrant A: Ignorable Risks
  2. Quadrant B: Nuisance Risks
  3. Quadrant C: Insurable Risks
  4. Quadrant D: The Company Killers

Identifying & Mitigating the Company Killers

Companies flatline when the cash runs out and total current liabilities (i.e., bills due now) exceed total liquid assets. Risk management is all about identifying and mitigating the uncertainties — especially the company killers — that surround cash flows.

Uncertainty plagues businesses in countless ways, but we can group most company killers into the following categories:

  1. Market Risks
  2. Competitive Risks
  3. Technology & Operational Risks
  4. Financial Risks
  5. People Risks
  6. Legal & Regulatory Risks
  7. Systemic Risks

The knowledge of risk management is also essential establishing a startup business. If you have any opinion, leave it in the comment box below or send us a message.

Is ETL Development doomed?

Is ETL Development doomed?

There seems to be a couple of tracks for this. First is the pure development automation tools, such as Varigence MIST. If you are technically minded, take a look at this product demo video – though I suggest skipping to about 25 minutes in to see the real meat as it does go on a bit. It looks mindbogglingly powerful but is clearly shooting at the ETL pro who wants to churn stuff out faster, more consistently and with less fiddling about. MIST is limited to SSIS/AS (for now) and I’m not sure how far it will go as it’s clearly aimed at the developer pro market, which is not always the big buyers. I expect to be playing with it more over the next few weeks on a live project so should be able to get a better view.

The second path appears to be more targeted at eliminating ETL developers in their entirety. AnalytixDS wraps up metadata import (i.e. you suck in your source and target metadata from the systems or ERWIN), do the mapping of fields and apply rules, then “push button make code”. Obviously there’s a bit more to it than that, but the less you care about your back end and the quality of your ETL code (cough Wherescape cough) the more likely this product will appeal to you. Say hello, business users, who are the big buyers (though I look forward to troubleshooting your non-scalable disasters in the near future).

Do you have any opinion? Share with us by leaving your comments below of send us a message.

iView Systems’ iTrak® Business Intelligence Delivers Dynamic Dashboard Risk Analytics & Reporting

iView Systems’ iTrak® Business Intelligence Delivers Dynamic Dashboard Risk Analytics & Reporting

iView Systems, a leading provider of loss prevention solutions for the security and surveillance environment, is excited to announce the most recent addition to the iTrak® family of Incident Reporting and Risk Management solutions, the iTrak® BI (Business Intelligence) Module. The iTrak® BI Module delivers powerful dashboard visualizations from information reported in the iTrak Incident Reporting and Risk Management and other data sources in real-time, providing users a visual representation of their incident and other iTrak information. This allows organizations to quickly extract meaningful business intelligence to detect emerging trends & identify risks, threats & vulnerabilities.

iTrak® BI real-time, interactive dashboard reporting and visualization.

  1. Manages dynamic business data, providing the ability to control the visualization and analysis of data in real-time.
  2. iTrak® BI is equipped with a large selection of high-quality data controls and visualizations, effectively presenting the data to associated audience.
  3. Connects and consolidates data into one system, regardless of where your data resides; saving time and money.
  4. iTrak® BI empowers end-users to create, interpret, analyze and drill down through a wealth of information for effective decision-making in real time.
  5. iTrak® BI adapts to the business so users don’t have to adapt to the product.
  6. iTrak® BI gives users a range of viewing options that are designed specifically for both desktop and mobile delivery providing important metrics on the-go.
  7. iTrak® BI allows communication, collaboration and the ability to take direct action via commenting capability directly on the dashboards – allowing effective and immediate the insight to make better business decisions.
  8. iTrak® BI Dashboards lets users choose, filter, format and sort metrics they need to see, with the ability to share and collaborate the finished results (mashups) with other users.
  9. The web-based solution lets users create, view, and interact with dashboards directly in a web browser – with no need to install a separate desktop application.

If you have any question, leave us comments below of send us a message.

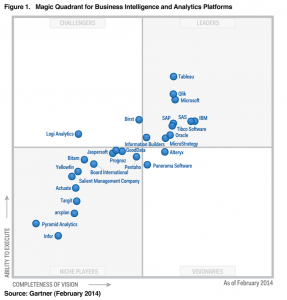
Magic Quadrant for Business Intelligence and Analytics Platforms

Magic Quadrant for Business Intelligence and Analytics Platforms

Magic Quadrant for Business Intelligence and Analytics Platforms

 Magic Quadrant for Business Intelligence and Analytics Platforms

Data discovery capabilities are dominating new purchasing  requirements, even for larger deployments, as alternatives to traditional BI tools. But “governed data discovery” — the ability to meet the dual demands of enterprise IT and business users — remains a challenge unmet by any one vendor.

The BI and analytics platform market is in the middle of an accelerated transformation from BI systems used primarily for measurement and reporting to those that also support analysis, prediction, forecasting and optimization. Because of the growing importance of advanced analytics for descriptive, prescriptive and predictive modeling, forecasting, simulation and optimization (see “Extend Your Portfolio of Analytics Capabilities”) in the BI and information management applications and infrastructure that companies are building — often with different buyers driving purchasing and different vendors offering solutions — this year Gartner has also published a Magic Quadrant exclusively on predictive and prescriptive analytics platforms (see Note 1). Vendors offering both sets of capabilities are featured in both Magic Quadrants.

For this Magic Quadrant, Gartner defines BI and analytics as a software platform that delivers 17 capabilities across three categories: information delivery, analysis and integration.

As a result of the market dynamics discussed above, the capability definitions in this year’s Magic Quadrant have been modified with the following additions and subtractions to reflect our current view of critical capabilities for BI and analytics platforms.
Capabilities dropped:

  1. Scorecard: Most companies do not implement true scorecard/strategy maps using BI platforms — they implement dashboards. Also, most BI vendors report limited sales activity for their scorecard products. Scorecards are primarily delivered by corporate performance management (CPM) vendors (see “Strategic CPM as a Driver for Organizational Performance Management”). Therefore, we have included scorecards as a type of dashboard, rather than as a separate category.
  2. Predictive Analytics: covered in the new “Magic Quadrant for Advanced Analytics Platforms.”
  3. Prescriptive Analytics: covered in the new “Magic Quadrant for Advanced Analytics Platforms.”

Capabilities added:

  1. Geospatial and location intelligence (see the Analysis section)
  2. Embedded advanced analytics (see the Analysis section)
  3. Business user data mashup and modeling (see the Integration section)
  4. Embeddable analytics (see the Integration section)
  5. Support for big data sources (see the Integration section)

Feel free to leave us your comments or send us a message.