Is ETL Development doomed?

Is ETL Development doomed?

There seems to be a couple of tracks for this. First is the pure development automation tools, such as Varigence MIST. If you are technically minded, take a look at this product demo video – though I suggest skipping to about 25 minutes in to see the real meat as it does go on a bit. It looks mindbogglingly powerful but is clearly shooting at the ETL pro who wants to churn stuff out faster, more consistently and with less fiddling about. MIST is limited to SSIS/AS (for now) and I’m not sure how far it will go as it’s clearly aimed at the developer pro market, which is not always the big buyers. I expect to be playing with it more over the next few weeks on a live project so should be able to get a better view.

The second path appears to be more targeted at eliminating ETL developers in their entirety. AnalytixDS wraps up metadata import (i.e. you suck in your source and target metadata from the systems or ERWIN), do the mapping of fields and apply rules, then “push button make code”. Obviously there’s a bit more to it than that, but the less you care about your back end and the quality of your ETL code (cough Wherescape cough) the more likely this product will appeal to you. Say hello, business users, who are the big buyers (though I look forward to troubleshooting your non-scalable disasters in the near future).

Do you have any opinion? Share with us by leaving your comments below of send us a message.

post

Data Science Is Dead

This article gives a very good criticism about the popular Data Science / Data Scientist these days. Data Science is something business people invented as a creative way for a new profession as a result of Big Data. “Science” is about creating knowledge as a result of study / research. Consequently, “Data Science” should be about creating knowledge through the study of data, not just data analysis, a/b testing, or troubleshooting which almost the majority of business people are doing. Essentially, the article claims data analysis / data troubleshoot is NOT Data Science.

Today it is a big hype for companies to look for Data Scientists with unrealistic expectation in those job ads. They are looking for a miracle medicine but a quick fix to data which they are unable to handle today. As a result, a short cut is taken and a new profession is created. Major software companies even invent new products to automate the jobs of Data Scientists! It is just like the story of the King’s New Robe. When a king was naked with an imaginary rob and walking down the street, everyone was so ashamed to be called stupid that they never called out the imaginary robe as a lie, not until kids, with their pure and untainted mind, laughing at the king’s stupid belief. The story was repeated to supply chain management (SCM) and is repeated to Big Data and Data Science today. People are so ashamed to be called stupid so they just follow the trend and try to build empires out of the trend. Companies are spending billions of dollars to just make reports as eye candy but do not really know how to use them to improve their bottom lines.

… you’ll realize that the “Big Data” vendors have filled your executives’ heads with sky-high expectations (and filled their inboxes with invoices worth significant amounts of money) …

The author claims there is no data science until you are working on “structured” data, where is most statistics draws its inference for prediction and control. The author emphasis the importance of “cleaning off the rotten banana peels” before you look at data so you won’t draw biased conclusion, which is totally against the idea of Big Data today.

I understand the importance of having fresh idea to keep people engaged in our advancement. Putting emotion aside, if possible, this article does provide a very bitter but true advice to Data Scientists.

Don’t be the data scientist tasked with the crime-scene cleanup of most companies’ “Big Data”—be the developer, programmer, or entrepreneur who can think, code, and create the future.

Reference: Data Science Is Dead

iView Systems’ iTrak® Business Intelligence Delivers Dynamic Dashboard Risk Analytics & Reporting

iView Systems’ iTrak® Business Intelligence Delivers Dynamic Dashboard Risk Analytics & Reporting

iView Systems, a leading provider of loss prevention solutions for the security and surveillance environment, is excited to announce the most recent addition to the iTrak® family of Incident Reporting and Risk Management solutions, the iTrak® BI (Business Intelligence) Module. The iTrak® BI Module delivers powerful dashboard visualizations from information reported in the iTrak Incident Reporting and Risk Management and other data sources in real-time, providing users a visual representation of their incident and other iTrak information. This allows organizations to quickly extract meaningful business intelligence to detect emerging trends & identify risks, threats & vulnerabilities.

iTrak® BI real-time, interactive dashboard reporting and visualization.

  1. Manages dynamic business data, providing the ability to control the visualization and analysis of data in real-time.
  2. iTrak® BI is equipped with a large selection of high-quality data controls and visualizations, effectively presenting the data to associated audience.
  3. Connects and consolidates data into one system, regardless of where your data resides; saving time and money.
  4. iTrak® BI empowers end-users to create, interpret, analyze and drill down through a wealth of information for effective decision-making in real time.
  5. iTrak® BI adapts to the business so users don’t have to adapt to the product.
  6. iTrak® BI gives users a range of viewing options that are designed specifically for both desktop and mobile delivery providing important metrics on the-go.
  7. iTrak® BI allows communication, collaboration and the ability to take direct action via commenting capability directly on the dashboards – allowing effective and immediate the insight to make better business decisions.
  8. iTrak® BI Dashboards lets users choose, filter, format and sort metrics they need to see, with the ability to share and collaborate the finished results (mashups) with other users.
  9. The web-based solution lets users create, view, and interact with dashboards directly in a web browser – with no need to install a separate desktop application.

If you have any question, leave us comments below of send us a message.

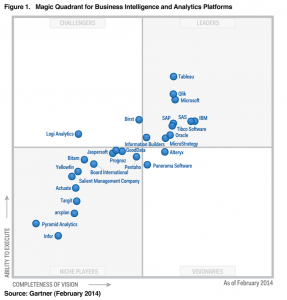
Magic Quadrant for Business Intelligence and Analytics Platforms

Magic Quadrant for Business Intelligence and Analytics Platforms

Magic Quadrant for Business Intelligence and Analytics Platforms

 Magic Quadrant for Business Intelligence and Analytics Platforms

Data discovery capabilities are dominating new purchasing  requirements, even for larger deployments, as alternatives to traditional BI tools. But “governed data discovery” — the ability to meet the dual demands of enterprise IT and business users — remains a challenge unmet by any one vendor.

The BI and analytics platform market is in the middle of an accelerated transformation from BI systems used primarily for measurement and reporting to those that also support analysis, prediction, forecasting and optimization. Because of the growing importance of advanced analytics for descriptive, prescriptive and predictive modeling, forecasting, simulation and optimization (see “Extend Your Portfolio of Analytics Capabilities”) in the BI and information management applications and infrastructure that companies are building — often with different buyers driving purchasing and different vendors offering solutions — this year Gartner has also published a Magic Quadrant exclusively on predictive and prescriptive analytics platforms (see Note 1). Vendors offering both sets of capabilities are featured in both Magic Quadrants.

For this Magic Quadrant, Gartner defines BI and analytics as a software platform that delivers 17 capabilities across three categories: information delivery, analysis and integration.

As a result of the market dynamics discussed above, the capability definitions in this year’s Magic Quadrant have been modified with the following additions and subtractions to reflect our current view of critical capabilities for BI and analytics platforms.
Capabilities dropped:

  1. Scorecard: Most companies do not implement true scorecard/strategy maps using BI platforms — they implement dashboards. Also, most BI vendors report limited sales activity for their scorecard products. Scorecards are primarily delivered by corporate performance management (CPM) vendors (see “Strategic CPM as a Driver for Organizational Performance Management”). Therefore, we have included scorecards as a type of dashboard, rather than as a separate category.
  2. Predictive Analytics: covered in the new “Magic Quadrant for Advanced Analytics Platforms.”
  3. Prescriptive Analytics: covered in the new “Magic Quadrant for Advanced Analytics Platforms.”

Capabilities added:

  1. Geospatial and location intelligence (see the Analysis section)
  2. Embedded advanced analytics (see the Analysis section)
  3. Business user data mashup and modeling (see the Integration section)
  4. Embeddable analytics (see the Integration section)
  5. Support for big data sources (see the Integration section)

Feel free to leave us your comments or send us a message.

Revolution Analytics named a Visionary in the Gartner Magic Quadrant for Advanced Analytics Platforms

Revolution Analytics named a Visionary in the Gartner Magic Quadrant for Advanced Analytics Platforms

The entire team at Revolution Analytics is very proud to announce that Gartner has named Revolution Analytics a Visionary in the inaugural Gartner Magic Quadrant for Advanced Analytics Platforms, published February 19, 2014. The report evaluated 16 vendors through a series of stringent criteria related to the ability to execute and completeness of vision.

Revolution Analytics is positioned the furthest for Completeness of Vision and Ability to Execute in the Visionaries Quadrant. We believe this is a validation of the leading-edge innovations of the open-source R community, and that of our own Revolution R Enterprise development team who continues to complement R with scalability, performance, and enterprise readiness. Here’s what CEO Dave Rich has to say:

“It’s such a pivotal moment for data scientists and the growing open-source R community that Gartner has embarked on its first ever Magic Quadrant for Advanced Analytics Platforms. Gartner estimates advanced analytics to be a $2 billion market that spans a broad array of industries globally, and ‘Gartner predicts business intelligence and analytics will remain top focus for CIOs Through 2017.’ We believe that this new Magic Quadrant puts a spotlight on big data as the great analytics disruptor and we feel highlights the need for solutions like Revolution Analytics’ that are built upon a flexible, open platform, and designed for today’s Big Data Big Analytics challenges.” — Dave Rich, CEO, Revolution Analytics

If you have any question, feel free to send us a messageor leave your comment below

Business Intelligence Barista: Mixing your choice of BI Coffee with Tableau, Power BI or Qlikview?

Business Intelligence Barista: Mixing your choice of BI Coffee with Tableau, Power BI or Qlikview?

Choosing a Business Intelligence is a bit like making coffee for the whole company. Everybody likes it their way, and they want it right now. Plus, everybody wants it differently. So, given that everyone has different requirements, how do you go about keeping everybody happy? If you think about how hard it is to keep everyone happy when you’re just making coffee, think how hard it is to select a business Intelligence solution. Not just any solution…. the *right* solution. 

So, given that everyone has different requirements, how do you go about keeping everybody happy? If you think about how hard it is to keep everyone happy when you’re just making coffee, think how hard it is to select a business Intelligence solution. Not just any solution…. the *right* solution. The one that will keep everyone happy and give them what they want. The solution that will keep the ambulance away from the door, where constraints must be met or there will be serious trouble. The solution that will keep everyone out of danger whilst making sure that the sprinkle lovers get their sprinkles, and the folks who like a chocolate covered spoon in their coffee get a little chocolate covered spoon – in milk, dark or white…

Hopefully this article could provide an insight for you to decide the best BI tools for you company. If you would like to know further, or if you have any question, please contact us or leave us comments below.

Five Data Mining Techniques That Help Create Business Value

Five Data Mining Techniques That Help Create Business Value

The term data mining first appeared in the 1990s while before that, statisticians used the terms “Data Fishing” or “Data Dredging” to refer to analysing data without an a-priori hypothesis. The most important objective of any data mining process is to find useful information that is easily understood in large data sets. There are a few important classes of tasks that are involved with data mining:

  1. Anomaly or Outlier detection
  2. Association rule learning
  3. Clustering analysis
  4. Classification analysis
  5. Regression analysis

Data mining can help organisations and scientists to find and select the most important and relevant information. This information can be used to create models that can help make predictions how people or systems will behave so you can anticipate on it. The more data you have the better the models will become that you can create using the data mining techniques, resulting in more business value for your organisation.

If you have any opinion about how data mining help to create business value, post it in the comment box. And contact us for discussion.

2013 in review: Big data, bigger expectations?

In the parlance of the industry, big data’s feat was a result of the successful convergence of the “three Vs”:

Volume: A large amount of data

Variety: A wide range of data types and sources

Velocity: The speed of data moving from its sources, into the hands of those who need it

Although other Vs have since been contemplated, such as Veracity and Value, the original three attributes promised big data could go far beyond the boundaries of traditional databases, which require data to be stored in rigid rows and columns.

However, over the past year, reality began to sink in: People came to realize what big data could and could not do. Unfortunately, performing large-scale analytics in real time proved to be more daunting than originally thought. Although Hadoop continues to be the world’s most popular big data processing platform, it was designed for batch processing and is far too slow for real-time use.

Reference: 2013 in review: Big data, bigger expectations?

Dashboards Help CIOs Manage Business Services

CIO.com has recently released an article introducing the following 6 business dashboards by putting data from a variety of enterprise applications and services at a CIO’s fingertips so he or she can better manage employees, website activity, development projects and company resources.

Kapta Dashboard

Kapta shows a summary of employee goals in an easily identifiable red, yellow and green—map to the overall company goals with a heat map. The map shows a breakdown of the percentage completion rate by groups within IT.

Continue reading