Bywaters waste management uses BI to improve customers’ recycling

Bywaters waste management uses BI to improve customers’ recycling

Bywaters, a recycling and waste management company, has improved productivity by 4% using Pentaho data integration and business intelligence software.

Sasha Korniak, head of analytics and data science at Bywaters, masterminded the project at the family-owned company, which operates nationally, and includes Nandos, Guy’s and St. Thomas’ Hospital, and BNP Paribas among its 2,000-plus customers.

“I wanted Bywaters to embrace a data-driven culture that would give authority and confidence to make autonomous decisions substantiated by credible data and enable consumers to increase recycling and sustainability,” says Korniak.

“We are no longer just a waste management company, we are a waste consultancy, improving our customers’ recycling through providing the data”, says Korniak. “If you are not data driven, but just go out and collect bins, the sustainability of your business will be damaged”.

If you have any opinions, leave a comment below or send us a message.

iView Systems’ iTrak® Business Intelligence Delivers Dynamic Dashboard Risk Analytics & Reporting

iView Systems’ iTrak® Business Intelligence Delivers Dynamic Dashboard Risk Analytics & Reporting

iView Systems, a leading provider of loss prevention solutions for the security and surveillance environment, is excited to announce the most recent addition to the iTrak® family of Incident Reporting and Risk Management solutions, the iTrak® BI (Business Intelligence) Module. The iTrak® BI Module delivers powerful dashboard visualizations from information reported in the iTrak Incident Reporting and Risk Management and other data sources in real-time, providing users a visual representation of their incident and other iTrak information. This allows organizations to quickly extract meaningful business intelligence to detect emerging trends & identify risks, threats & vulnerabilities.

iTrak® BI real-time, interactive dashboard reporting and visualization.

  1. Manages dynamic business data, providing the ability to control the visualization and analysis of data in real-time.
  2. iTrak® BI is equipped with a large selection of high-quality data controls and visualizations, effectively presenting the data to associated audience.
  3. Connects and consolidates data into one system, regardless of where your data resides; saving time and money.
  4. iTrak® BI empowers end-users to create, interpret, analyze and drill down through a wealth of information for effective decision-making in real time.
  5. iTrak® BI adapts to the business so users don’t have to adapt to the product.
  6. iTrak® BI gives users a range of viewing options that are designed specifically for both desktop and mobile delivery providing important metrics on the-go.
  7. iTrak® BI allows communication, collaboration and the ability to take direct action via commenting capability directly on the dashboards – allowing effective and immediate the insight to make better business decisions.
  8. iTrak® BI Dashboards lets users choose, filter, format and sort metrics they need to see, with the ability to share and collaborate the finished results (mashups) with other users.
  9. The web-based solution lets users create, view, and interact with dashboards directly in a web browser – with no need to install a separate desktop application.

If you have any question, leave us comments below of send us a message.

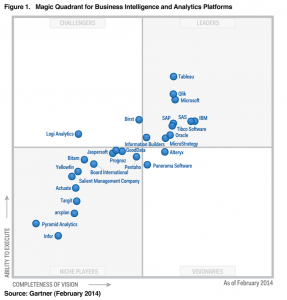
Magic Quadrant for Business Intelligence and Analytics Platforms

Magic Quadrant for Business Intelligence and Analytics Platforms

Magic Quadrant for Business Intelligence and Analytics Platforms

 Magic Quadrant for Business Intelligence and Analytics Platforms

Data discovery capabilities are dominating new purchasing  requirements, even for larger deployments, as alternatives to traditional BI tools. But “governed data discovery” — the ability to meet the dual demands of enterprise IT and business users — remains a challenge unmet by any one vendor.

The BI and analytics platform market is in the middle of an accelerated transformation from BI systems used primarily for measurement and reporting to those that also support analysis, prediction, forecasting and optimization. Because of the growing importance of advanced analytics for descriptive, prescriptive and predictive modeling, forecasting, simulation and optimization (see “Extend Your Portfolio of Analytics Capabilities”) in the BI and information management applications and infrastructure that companies are building — often with different buyers driving purchasing and different vendors offering solutions — this year Gartner has also published a Magic Quadrant exclusively on predictive and prescriptive analytics platforms (see Note 1). Vendors offering both sets of capabilities are featured in both Magic Quadrants.

For this Magic Quadrant, Gartner defines BI and analytics as a software platform that delivers 17 capabilities across three categories: information delivery, analysis and integration.

As a result of the market dynamics discussed above, the capability definitions in this year’s Magic Quadrant have been modified with the following additions and subtractions to reflect our current view of critical capabilities for BI and analytics platforms.
Capabilities dropped:

  1. Scorecard: Most companies do not implement true scorecard/strategy maps using BI platforms — they implement dashboards. Also, most BI vendors report limited sales activity for their scorecard products. Scorecards are primarily delivered by corporate performance management (CPM) vendors (see “Strategic CPM as a Driver for Organizational Performance Management”). Therefore, we have included scorecards as a type of dashboard, rather than as a separate category.
  2. Predictive Analytics: covered in the new “Magic Quadrant for Advanced Analytics Platforms.”
  3. Prescriptive Analytics: covered in the new “Magic Quadrant for Advanced Analytics Platforms.”

Capabilities added:

  1. Geospatial and location intelligence (see the Analysis section)
  2. Embedded advanced analytics (see the Analysis section)
  3. Business user data mashup and modeling (see the Integration section)
  4. Embeddable analytics (see the Integration section)
  5. Support for big data sources (see the Integration section)

Feel free to leave us your comments or send us a message.

Business Intelligence Barista: Mixing your choice of BI Coffee with Tableau, Power BI or Qlikview?

Business Intelligence Barista: Mixing your choice of BI Coffee with Tableau, Power BI or Qlikview?

Choosing a Business Intelligence is a bit like making coffee for the whole company. Everybody likes it their way, and they want it right now. Plus, everybody wants it differently. So, given that everyone has different requirements, how do you go about keeping everybody happy? If you think about how hard it is to keep everyone happy when you’re just making coffee, think how hard it is to select a business Intelligence solution. Not just any solution…. the *right* solution. 

So, given that everyone has different requirements, how do you go about keeping everybody happy? If you think about how hard it is to keep everyone happy when you’re just making coffee, think how hard it is to select a business Intelligence solution. Not just any solution…. the *right* solution. The one that will keep everyone happy and give them what they want. The solution that will keep the ambulance away from the door, where constraints must be met or there will be serious trouble. The solution that will keep everyone out of danger whilst making sure that the sprinkle lovers get their sprinkles, and the folks who like a chocolate covered spoon in their coffee get a little chocolate covered spoon – in milk, dark or white…

Hopefully this article could provide an insight for you to decide the best BI tools for you company. If you would like to know further, or if you have any question, please contact us or leave us comments below.

Supply Chain, Risk, and BI Management

Supply Chain, Risk, and BI Management

Greetings:

In response to colleagues request and market demand for SCM, BI, and Risk, I am initiating a lecture (posting) series under the title of:

“Risk, and Business Intelligence in the context of Supply and Demand Chain Management.”

Continue reading

Business Intelligence

Business Intelligence

Prelude:

Business Intelligence is information retrieved by analysis of data collected from operational processes of a business. The analysis is based on a presumed mathematical or empirical model defining the data interrelationship. In conjunction with the same information from competition, one may devise a blue print in achieving specified goals. Additionally, in a predictive mode, in depth review and analysis of Business Intelligence, may point toward proactive measures to be taken in meeting the business’s tactical and strategic objectives. In general, Business Intelligence is a barometer of how good or bad a business is running. Consequently, the accurate collection of pertinent data and the understanding of the interrelationships among data have a paramount impact in design of a road map for success. By the same token, proper collection of Business Intelligence from competition, as an initial targeted goals, is also fundamentally important.

Our definition of Business Intelligence is the basis for methods deployed for our operational projects and educational curriculum.

In near future, in the following sections, we will describe commonly used mathematical and empirical methods of Business Intelligence.

Continue reading