Big data analytics technology: disruptive and important?

Of all the disruptive technologies we track, big data analytics is the biggest. It’s also among the haziest in terms of what it really means to supply chain. In fact, its importance seems more to reflect the assumed convergence of trends for massively increasing amounts of data and ever faster analytical methods for crunching that data. In other words, the 81percent of all supply chain executives surveyed who say big data analytics is ‘disruptive and important’ are likely just assuming it’s big rather than knowing first-hand.

Does this mean we’re all being fooled? Not at all. In fact, the analogy of eating an elephant is probably fair since there are at least two things we can count on: we can’t swallow it all in one bite, and no matter where we start, we’ll be eating for a long time.

So, dig in!

Getting better at everything

Searching SCM World’s content library for ‘big data analytics’ turns up more than 1,200 citations. The first screen alone includes examples for spend analytics, customer service performance, manufacturing variability, logistics optimisation, consumer demand forecasting and supply chain risk management.

Read more at Big data analytics technology: disruptive and important?

Share your opinions regarding this topic in the comment box below and subscribe us for more updates.

Data Lake vs Data Warehouse: Key Differences

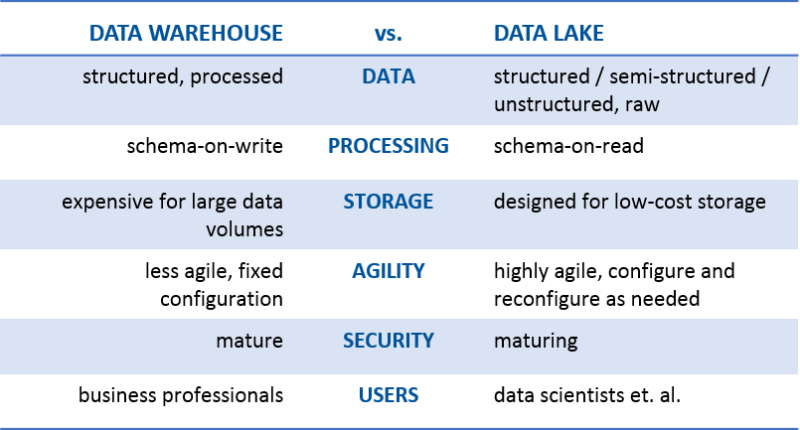
Some of us have been hearing more about the data lake, especially during the last six months. There are those that tell us the data lake is just a reincarnation of the data warehouse—in the spirit of “been there, done that.” Others have focused on how much better this “shiny, new” data lake is, while others are standing on the shoreline screaming, “Don’t go in! It’s not a lake—it’s a swamp!”

All kidding aside, the commonality I see between the two is that they are both data storage repositories. That’s it. But I’m getting ahead of myself. Let’s first define data lake to make sure we’re all on the same page. James Dixon, the founder and CTO of Pentaho, has been credited with coming up with the term. This is how he describes a data lake:

“If you think of a datamart as a store of bottled water – cleansed and packaged and structured for easy consumption – the data lake is a large body of water in a more natural state. The contents of the data lake stream in from a source to fill the lake, and various users of the lake can come to examine, dive in, or take samples.”

And earlier this year, my colleague, Anne Buff, and I participated in an online debate about the data lake. My rally cry was #GOdatalakeGO, while Anne insisted on #NOdatalakeNO. Here’s the definition we used during our debate:

“A data lake is a storage repository that holds a vast amount of raw data in its native format, including structured, semi-structured, and unstructured data. The data structure and requirements are not defined until the data is needed.”

Read more Data Lake vs Data Warehouse: Key Differences

What do you think about this topic? Share your opinions below and subscribe us to get updates in your inbox.


INFO GRAPHICS WITH EXCEL

I’m not always the biggest fan of info graphics. Many of the posters-sized info graphics released these days have issues. But lately I’ve also received several requests on how to do info graphics with Excel. Many people don’t know where to start.

How Info Graphics are Different
Info graphics differ somewhat from your usual dashboard-style reporting. When we report with business tools, we use the data points–charts, tables, etc–to investigate a problem or monitor a system. That is, we use data to find results. Info graphics are used when we already know the results and we want to present it in an interesting, sometimes even artistic, way. Info graphics, then, are more about style and appearance–they wouldn’t necessarily find a good home on a dashboard. But they do work well in magazines, newspapers, and some student projects.

Info Graphics and Excel
Many info graphics are made with graphic editing programs like Adobe Illustrator. As far as I know, these illustrations are static. So each change in the underlying data won’t be automatically updated in the graphic. You would just have to redraw the graphic. Excel provides a benefit here: if we use Excel’s charts to make our info graphics, we can update the underlying data and the result appears automatically.

Read more at INFO GRAPHICS WITH EXCEL

Write your opinions about this article below and subscribe us for the latest article in your inbox.

3 ways to strengthen security with software supply-chain automation

Federal agencies are striving to become more innovative and iterative, leading to growing adoption of open source within the government. The issuance earlier this year of the Federal Source Code Policy illustrates how this technology, once anathema to government agencies, has become the de facto standard for the creation and deployment of many applications.

With the explosive adoption of open-source components being used to assemble applications, agency personnel are now tasked with ensuring the quality of the components that are being used. Developers must have confidence in components’ security, licensing and quality attributes and know for certain that they are using the latest versions.

Unfortunately, many agencies that are adopting the RMF are also relying on outdated and inefficient practices and tools that are not designed for today’s open and agile world. In addition to relying on potentially vulnerable components to build applications, some agencies have continued to depend too heavily on common application security tools, such as static application security testing and dynamic application security testing.

Continue reading

Six signs that your Big Data expert, isn’t

big-data-iceberg-napkin-21-608x608

This is so far the best article that I have been reading about the Big Data. It is what I have been advocating to people.

1. They talk about “bigness” and “data,” rather than “new questions”

… It seems most of the tech industry is completely drunk on “Big Data.”

… most companies are spending vast amounts of money on more hardware and software yet they are getting little, if any, positive business value.

… “Big Data” is a terrible name for the revolution going on all around us. It’s not about Bigness, and it’s not about the Data. Rather, it’s about “new questions,” being facilitated by ubiquitous access to massive amounts of data.

… If all you’re doing is asking the same old questions of bigger amounts of the same old data, you’re not doing “Big Data,” you’re doing “Big Business Intelligence,” which is itself becoming an oxymoron.

Continue reading

Top 2,500 Data Science, Big Data and Analytics Websites

The following comprehensive listings were produced by analyzing our large member database, extracting websites that our members mentioned or liked, and for each web site, identifying

  1. When it is first mentioned by one of our members
  2. The number of times it was mentioned
  3. Keywords found when visiting the front page with a web crawler, using a pre-selected list of seed keywords

The design of the member database (non-mandatory sign-up questions and choices offered to new members on sign-up) was done by our home data scientist (me) long ago, precisely with the purpose in mind of performing analyses like this one, down the road. Other analyses produced in the past include: 6,000 companies hiring data scientists, best cities for data scientists, demographics of data scientists, and 400 job titles for data scientists: see related links at the bottom of this article.

Read more at Top 2,500 Data Science, Big Data and Analytics Websites

Share your opinions with us in the comment box and subscribe to get updates in your inbox.

10 Web Scraping Tools

Web Scraping tools are specifically developed for extracting information from websites. They are also known as web harvesting tools or web data extraction tools. These tools are useful for anyone trying to collect some form of datafrom the Internet. Web Scraping is the new data entry technique that don’t require repetitive typing or copy-pasting.

These software look for new data manually or automatically, fetching the new or updated data and storing them for your easy access. For example, one may collect info about products and their prices from Amazon using a scraping tool. In this post, we’re listing the use cases of web scraping tools and the top 10 web scraping tools to collect information, with zero coding.

Use Cases of Web Scraping Tools:

  1. Collect Data for Market Research
  2. Extract Contact Info
  3. Look for Jobs or Candidates
  4. Track Prices from Multiple Markets

Tools:

  1. Import.io
  2. Webhose.io
  3. CloudScrape
  4. Scrapinghub
  5. ParseHub
  6. VisualScraper
  7. Spinn3r
  8. 80legs
  9. Scraper
  10. OutWit Hub

Read more at 10 Web Scraping Tools

What do you think about this topic? Leave your comment below and subscribe us to get updates.

Firms may violate workers’ medical privacy with big data

stat

It may be time to take a step back and re-evaluate how U.S. companies are using big data gathered in employee wellness and other health care analytics programs.

… In an editorial posted Tuesday in JAMA Internal Medicine, some Texas researchers argue that use of big data to predict the “risk” of a woman getting pregnant may be crossing a line. It could exacerbate long-standing patterns of employment discrimination and paint pregnancy as something to be discouraged.

… The concern arose after reports of how one health care analytics company launched a product that can track, for example, if a woman has stopped filling birth-control prescriptions or has searched for fertility information on the company’s app. And women may not even be aware that such data is being collected.

… About half of large firms that provided health benefits to employees in 2015 either offered or required that they complete health risk assessments or undergo biometric screenings, according to a recent analysis. Corporate wellness services is a booming industry generating annual revenue of about $1.8 billion.

Read more at Firms may violate workers’ medical privacy with big data

Should you have any questions, contact us for discussion or leave your comments below.

A Tale of Two Disciplines: Data Scientist and Business Analyst

data scientist and BA

The ability to use data to achieve enterprise goals requires advanced skills that many organizations don’t yet have. But they are looking to add them – and fast. The question is, what type of big data expert is needed? Does an organization need a data scientist or does it need a business analyst? Maybe it even needs both. These two titles are often used interchangeably, and confusion abounds.

Business analysts typically have educational backgrounds in business and humanities. They find and extract valuable information from a variety of sources to evaluate past, present, and future business performance – and then determine which analytical models and approaches will help explain solutions to the end users who need them.

With educational backgrounds in computer science, mathematics, and technology, data scientists are digital builders. They use statistical programming to actually construct the framework for gathering and using the data by creating and implementing algorithms to do it. Such algorithms help businesses with decision making, data management, and the creation of data visualizations to help explain the data that they gather.

Read more at A Tale of Two Disciplines: Data Scientist and Business Analyst

Share your opinions in the comment box below and subscribe us to get updates in your inbox.

Why are global supply chains becoming more fragile?

General Motors recently recalled nearly 4.3 million vehicles with defective software. The bankruptcy of Hanjin Shipping, one of the world’s largest ocean carriers, left half a million containers with $14 billion worth of goods stranded at sea.

Fiat Chrysler recalled 1.9 million vehicles worldwide for possible airbag and seat belt failures. Samsung had to recall a million of its newly launched Galaxy Note 7 smartphones after some devices burst into flames. And in Europe, Volkswagen was forced to shut down production of nearly 10,000 vehicles after a supplier refused to deliver key components.

These examples all point to two worrying questions: are global supply chains becoming more fragile and if so, why?

The above Volkswagen example is a good place to start to find answers and begin to address this issue begins it soon becomes apparent this fragility is itself, the first signs of a major shift for global supply chains.

Inherent imbalances – from single company to ecosystem

The automotive industry has come a long way since Henry Ford’s Motor Company mke everything that went into its product in-house. Today, 75 percent of automotive parts are not designed or built by car manufactures themselves but by their suppliers.

That means that manufacturing a car is no longer the job of a single enterprise. It’s the job of a complex ecosystem of supply chain partners. And VW is no exception. Indeed, any manufacturer of a complex product such as a car, hi-tech consumer electronics or even clothing relies upon its ecosystem of suppliers far more than the manufacturer may realize.

Read more at Why are global supply chains becoming more fragile?

Share your opinions in the comment box below and subscribe us to get updates in your inbox.