How business intelligence is helping global businesses succeed

  • person wearing suit reading business newspaper

In today’s always connected and hyper-competitive world, growing market share is a challenge for any organisation. Industry leaders understand that to get an edge over their competitors they need new and better insights into their business to help identify hidden risks and mitigate them and inform their decision making in everything from finding supply chain inefficiencies to uncovering new avenues for sales.

Having actionable intelligence can be the difference between success and failure, but sorting through the wealth of data every modern global business generates is a complex task and it is too easy to miss a critical information point. Business intelligence platforms help companies sift, sort, and process this data into different types of reports with actionable insights that highlight any weaknesses to address and strengths that should be built upon.

Here are four ways business intelligence can help a global business find success.

Help with product pricing

Pricing a product or service can be a difficult question. Business leaders need to find a price point within a specific market that is sufficiently low to attract new customers away from their competitors, but sufficiently high that they can drive profits and create a growing and successful company.

It is difficult enough to try and determine the best price within a single geographic market, such as the UK, but when you look to expand the business abroad, each geographical market has its own unique set of economic and market factors that need to be taken into account. The company will need to set a different price targeted to each local market conditions, and business intelligence can bring together all the relevant data and help stakeholders find the best pricing strategy for wherever they plan to launch.

Identify supply chain efficiencies and weaknesses

Modern supply chains cross continents, and a few days delay at a port in China or a ship that has taken a wrong turn can have roll on impacts throughout a business. The data at each point in this supply chain may be stored in different systems that may be region or sector specific, and trying to combine all that data can be a slow and laborious process.

Business intelligence platforms can help companies integrate these disparate sources of data and create insights such as where in the supply chain is the weakest link and where companies should possibly look for backup solutions should issues arise, and also where stock is left sitting in warehouses for long periods, costing money for storage and creating expensive inefficiencies.

Nurture customer loyalty

The sales and marketing investment required to find new customers is expensive, and so all businesses need to nurture their relationship with the current customers to maintain profitability. These relationships are more challenging to maintain for businesses with overseas operations, as priorities and social niceties vary significantly from region to region, with what some would consider good manners in one country sometimes considered rude in another.

The leader of well established global company understands that standardised customer engagement programmes often do not work well across borders, and local solutions need to be devised. However, maintaining a variety of different programmes around the world is burdensome and it can be a struggle to compare how each performs.

Read more at How business intelligence is helping global businesses succeed

Leave your opinions in the comment box below and subscribe us to get updates.

How Visual Data Can Improve Performance Management in Business

person holding pencil near laptop computer

How Visual Data Can Improve Performance Management in Business

Nowadays, employees like to be recognized for the work they do. They want to know that the work they put in is valued. One way of doing this is to give them a detailed performance review and performance appraisal.

But how do you know if your employees are truly performing at their best?

Workplace performance is a very subjective thing to measure for any employee. The usual way of doing this is through an annual performance appraisal. Although this is a decent way to measure performance, it can often lead to situations where employees try to game the system or are afraid to speak the truth. There are many different tools for measuring workplace performance now and one of them is to utilize visual data for performance management.

This blog will look at some of the ways you can use visual data to improve performance management in your Business.

What is performance management?

Performance management is the continuous process of setting objectives, assessing progress, and providing ongoing coaching and feedback to ensure that employees are meeting their goals and career interests. The primary goal of performance management is to promote and improve employee effectiveness.

Performance management can be used to:

  1. Align employee goals with those of the organization
  2. Increase employee engagement
  3. Improve workforce productivity
  4. Encourage ongoing development
  5. Support goal attainment

Performance management is not just annual performance reviews. It includes planning work and setting expectations, continually monitoring performance, developing the capacity to perform, periodically rating performance in a summary fashion, and rewarding good performance.

The primary purpose of PM is to help employees understand how they contribute to organizational success through their individual roles and responsibilities.

Performance management is a stage-by-stage process for managing performance and improving employee performance. It includes the following stages:

  1. Setting clear expectations
  2. Monitoring progress against those expectations
  3. Providing regular feedback
  4. Celebrating successes and addressing failures
  5. Rewarding great performance

The performance management process has four stages:

  1. Planning: This stage involves setting objectives that are aligned with your company’s goals, helping employees understand their role in achieving those objectives, and ensuring everyone is focused on the right priorities.
  2. Tracking: Employees need to know how they’re getting along. In this phase, managers should provide regular coaching and feedback on progress toward defined objectives.
  3. Developing: When an employee needs support in meeting their objectives, the development phase kicks in. In this phase, managers work with employees to identify opportunities for learning or skill development or offer training programs or other
  4. Current trends in performance management: Current trends in performance management are changing this approach. They’re moving away from traditional methods and towards more continuous feedback loops that focus on encouraging employee development throughout the year.

Read more at How Visual Data Can Improve Performance Management in Business

Subscribe us to get updates, and leave your comments below

What is Financial Risk Management and Why Study It?

green plant in clear glass vase

What is Financial Risk Management and Why Study It?

Every business, regardless of size, deals with some degree of risk. There are several variables to consider for every decision involving finance, and a certain amount of risk can never be avoided. But it can certainly be mitigated. As such, companies are increasingly looking to specialists in the field for expert evaluations to help make decisions that directly impact a business’ revenue. Read more about financial risk management and why it’s a promising career…

What is financial risk management?

Every investment comes with potential risks. In fact, there is no profit without risk. Contrary to what we are used to, risks in finance can be positive as well as negative. In short, a risk is any deviation from the expected outcome. Risk management is the necessary step of evaluating possible outcomes, analyzing potential gains and losses, and deciding on what action should be taken (or not) given the conclusions from the evaluation.

Why study it?

A 2019 report by Accenture indicated that new investment risks are emerging with unprecedented speed. The top three new challenges appointed by specialists were disruptive technology, data breaches, and operational risks. Moreover, climate change has become a factor to be considered as property, infrastructure, and land damage pose new challenges.

Sustainable economy

While some may believe financial risk pertains only to high-ranking CEOs and investors, it’s essential to understand how it affects everyone. A country’s population is entirely interconnected through its financial system, and poor financial decisions can lead to an unreliable market and a declining economy. Having a reliable financial market means a stable and sustainable economy, in which everyone will benefit from better living conditions.

Solve climate change risks

As mentioned, the reality of climate change can affect businesses and investments in many ways. Besides the physical risks of property damage, business disruption, and the need for relocation, factors like technological transition and policy changes need to be considered in a risk analysis.

Cybersecurity

Cyber risk is the number one threat to the global financial system, says U.S. Federal Reserve Chairman Jerome Powell. Financial institutions are prime targets for cyberattacks, and sector leaders have appointed cyber security to be at the top of their priorities, rising above every other potential risk. Risk managers need to develop strategies to effectively deal with the cyber threat in a world that relies on technology to keep the global economy afloat.

Cryptocurrencies

The recent boom in cryptocurrency assets can directly affect the overall financial system. A report by the Financial Stability Board has highlighted vulnerabilities in the crypto market, such as linkages with the regulated financial system, liquidity mismatch, and credit and operational risks. Blockchain intelligence companies have invested in risk management technology, but this remains a sector that will need to be followed closely as it further develops.

Geopolitics

Not many companies fully consider how geopolitics involves a variety of financial risks. Access to natural resources, proximity to countries in conflict, limits on foreign relations, corruption, and local culture are just some factors to consider in a risk analysis. Each location provides a particular financial scenario, and only by fully understanding this context can a business use it to its advantage.

Work opportunities

A specialized professional in financial risk management is necessary for every business. Many companies hire consultants or teams to anticipate exposure, quantify the risk, and plan mitigation strategies. As a risk specialist, you can work in sales, trading, marketing, banking, and many other sectors, while benefiting from the increasing demand for qualified professionals in the field.

Read more at What is Financial Risk Management and Why Study It?

Subscribe us to get more updates, and leave your comments below

10 Supply Chain Risk Management Strategies

10 Supply Chain Risk Management Strategies

The supply chain is the gas that makes the motor run for manufacturing and retail. Without it, you have no product to sell, no inventory to stock, and no revenue to earn. Unfortunately, there will always be disruptions to the supply chain that throw everything out of whack and force both retailers and manufacturers to scramble to pick up the pieces. In a Gartner survey, only 21% of respondents stated they had a highly resilient network, though more than half expected to be “highly resilient” within a few years. That’s a positive sign, but what exactly can be done to get ahead of those supply chain risk factors?

Proper supply chain risk management enables businesses of all shapes and sizes to take advantage of tried-and-true strategies that mitigate risk and set them up for success. In order to develop your own risk management strategy, it helps to first understand what supply chain risks you might face.

What Are Some Supply Chain Risks?

Supply chain risk management refers to the process by which businesses take strategic steps to identify, assess, and mitigate risks within their end-to-end supply chain. There are both internal and external risks that can disrupt your supply chain, so it’s helpful to understand the difference between the two.

External Supply Chain Risks

As the name implies, these global supply chain risks come from outside of your organization. Unfortunately, that means that they are harder to predict and typically require more resources to overcome. Some of the top external supply chain risks include:

  1. Demand Risks: Demand risks occur when you miscalculate product demand and are often the product of a lack of insight into year-over-year purchasing trends or unpredictable demand.
  2. Supply Risks: Supply risks occur when the raw materials your business relies on aren’t delivered on time or at all, thereby causing disruption to the flow of product, material, and/or parts.
  3. Environmental Risks: Environmental risk in the supply chain is the direct result of social-economic, political, governmental, or environmental issues that affect the timing of any aspect of the supply chain.
  4. Business Risks: Business risks occur whenever unexpected changes take place with one of the entities you depend on to keep your supply chain running smoothly — for example, the purchase or sale of a supplier company.

Internal Supply Chain Risks

This refers to any supply chain risk factors that are within your control, and that can be identified and monitored using supply chain risk assessment software, robust analytics programs, IoT capabilities, and more. Although internal supply chain risks are more manageable than external ones, they’re still — to some degree — unavoidable. Here’s what to look for:

  1. Manufacturing Risks: Manufacturing risks refer to the possibility that a key component or step of your workflow could be disrupted, causing operations to go off schedule.
  2. Business Risks: Business risks are a product of disruptions to standard personnel, management, reporting, and other essential business processes.
  3. Planning and Control Risks: Planning and control risks are caused by inaccurate forecasting and assessments and poorly planned production and management.
  4. Mitigation and Contingency Risks: Mitigation and contingency risks can occur if your business doesn’t have a contingency plan for supply chain disruptions.

Read more at 10 Supply Chain Risk Management Strategies

If you have a question, please write it in the comment, and subscribe us to get updates.

8 Best Data Visualization Tools that Every Data Scientist Should Know

"A

Data scientists have to analyze, interpret, and visualize large datasets on a daily basis. This is why it is important for them to have the right data visualization tools at their disposal.
It can be difficult for people who don’t work closely with data every day (such as managers or executives) to grasp what they are trying to say if all they give them is words on paper or an Excel spreadsheet full of numbers without any context.
Data visualization tools allow data scientists to communicate their findings more effectively, which is important because it allows them to share their insights with other people who may not be familiar with data science concepts.

Best Data Visualization Tools for Every Data Scientist

In this article, we shall take a look at some of the best data visualization tools for data scientists and how they can effectively increase the efficiency of data scientists. Here are eight important data visualization tools to help data scientists make better-informed decisions.

1. Tableau

Tableau is a data visualization tool that can be used to create interactive graphs, charts, and maps. It allows you to connect to different data sources and create visualizations in minutes.

2. QlikView

QlikView is not just another data visualization tool, It is a data discovery platform that empowers the users to make faster, more informed decisions by accelerating analytics, revealing new business insights, and increasing the accuracy of results.

3. Microsoft Power BI

The Microsoft Power BI is the data visualization tool that is used for business intelligence type of data. It is and can be used for reporting, self-service analytics, and predictive analytics.

4. Datawrapper

Datawrapper is an online data visualization tool that can be used in various contexts. It is very easy to use, and it has a clean and intuitive user interface.

5. Plotly

Plotly is a data visualization tool that is used to create interactive graphs, charts, and maps. You can also use Plotly to create a visualization of a dataset, then share the link of that visualization with your readers on social media or on your blog.

6. Sisense

Sisense is a data visualization tool that allows you to easily create interactive visualizations from your data. With Sisense, you can quickly and easily create extensive, informative dashboards that will help you understand your data better.

7. Excel

Microsoft Excel is a data visualization tool that has an easy interface, so it doesn’t have to be difficult to work with.

8. Zoho analytics

Zoho Analytics is a data visualization and reporting tool that can help you to easily create custom reports and dashboards.

Conclusion

In the modern world, data is everywhere and it’s important for brands to be able to decode and communicate their message in an effective manner.
And for data scientists, learning and keeping up with all the latest data visualization tools is paramount, and only after they master this art, they can keep up with the pace of big data, and the fast-moving realms of AI and ML.

Supply chain analytics: 5 tips for smoother logistics

Organizations are increasingly turning to data analytics to navigate supply chain disruptions and to enhance their SCM efforts. Here’s how to do it right.

Organizations are increasingly turning to data analytics to navigate supply chain disruptions and to enhance their SCM efforts. Here’s how to do it right.

The worldwide supply chain challenges that plagued companies in multiple industries throughout 2021 are continuing this year. One potentially effective solution for addressing supply and demand issues is to leverage data analytics.

Professional services and consulting firm KPMG in a recent report notes that several major disruptions are currently affecting supply chains. These include the ongoing global logistics disruptions stemming from the COVID-19 pandemic that continue to impact businesses and consumers — as the flow of goods into key markets is restricted by shutdowns of major global ports and airports.

The major logistics disruptions create a ripple effect across global supply chains that ultimately cause goods to pile up in storage, the firm says. Assuming that these disruptions decrease and access to sea and airfreight reverts back to pre-pandemic levels, it will likely take some time before things return to normal, it says.

Other factors contributing to supply chain problems include production delays, over reliance on a limited number of third parties, and labor market shortages. The report also points out that many companies are investing in technologies to automate key nodes within the supply chain.

This year will see an accelerated level of investment, KPMG says, as businesses look to enhance critical supply chain planning capabilities by adopting more advanced “digital enablers” such as cognitive planning and AI-driven predictive analytics.

“The onset of new technology has fundamentally changed the way supply chains operate globally,” the report says. “The consumers are becoming more demanding, and this is leading the supply chains to change and evolve at a faster rate. Modern operations are focused on technology and innovations, and as a result, supply chains are becoming more complex.”

How can organizations best use data analytics to enhance their supply chain management (SCM) efforts? Here are some best practices, according to experts.

Turn data into actionable, simple insights

Most companies are awash in large volumes of data, often stored in diverse systems and databases, says John Abel, CIO at networking technology company Extreme Networks. Supply chains have the added complexity of additional data sources being generated from extended partners such as outsourcing, logistics, and distribution operations, he adds.

“As a result, many struggle to use this data to generate meaningful insights beyond top-level metrics and descriptive statistics,” Abel says. “Data analytics tools can deliver deeper, actionable insights as well as improve accuracy of those insights.”

Focus analytics on difference-making areas

Supply chain organizations are being inundated with data such as customer orders, item information, equipment utilization, and ever-evolving transportation costs, says Erik Singleton, expert practitioner for global supply chain at consultancy North Highland Worldwide Consulting.

“The key to building a successful, customer-centric supply chain while maximizing operational efficiency is using the right analytics to make data-driven decisions,” Singleton says. He recommends that supply chain organizations focus their analytics on three main areas.

Leverage real-time data to deal with disruptions

As both the size and complexity of supply chains grow globally, it is becoming exponentially more difficult to manage and respond to fluctuations across the supply chain, Abel says.

“With data points changing rapidly, analysis and decision-making is often based on outdated information and further exacerbated by the time needed to effectively analyze the data,” Abel says. “To navigate this successfully, supply chain managers need to develop concurrent planning systems that optimize demand and supply by utilizing advanced analytics and real-time visibility across the supply chain.”

Emphasize data governance and quality

The old adage about information, “garbage in, garbage out,” certainly applies to supply chain data, says Mark Korba, vice president of supply chain and business intelligence at Optimas Solutions, a fastener manufacturer and distributor.

“It is important to validate data, especially since it is coming from a variety of sources,” including customer inventory management systems, demand planning applications, supplier software, and others, Korba says. “Often the data isn’t consistent or managed the same across systems, and therefore lacks integrity.”

Make supply chain analytics broadly available

SCM involves multiple facets of the organization, so analytics capabilities need to be shared liberally.

“Make it easy for everyone involved in the supply chain to get the data and tools that they need,” says Arthur Hu, senior vice president and CIO at computer hardware provider Lenovo. “This first requires breaking down any ‘information silos’ and establishing an integrated end-to-end information system.”

Read more Supply chain analytics: 5 tips for smoother logistics

Leave your comments below and subscribe to us for new updates.

A blueprint for cyber supply chain risk management

A blueprint for cyber supply chain risk management

A blueprint for cyber supply chain risk management

One challenge for supply chain security practitioners is choosing which of the multitude of guidance documents and best practice frameworks to use when building a cyber supply chain risk management (C-SCRM) program. There is no touchstone in this arena; instead, we have shades and gradations of goodness and a plurality of approaches.

The U.S. Department of Commerce’s National Institute of Standards and Technology (NIST), SAFECode, The East-West Institute, Critical Infrastructure Coordinating Councils, and many others have published guidance on methods to address cyber supply chain risks. But to date, there is little evidence that C-SCRM practices are effective in stopping or reducing cyberattacks.

This lack of objective evidence of efficacy makes it difficult for a practitioner to choose which guidance or practices or framework to use in our own operations.

When faced with this problem several years ago, at the outset of developing a C-SCRM function for a large enterprise, I created a compilation of different practices from various publications. This article is based on the compilation and provides a short narrative about why certain practices are included.

The compilation is primarily derived from practices described in NIST Special Publication 800-161, Cyber Supply Chain Risk Management Practices for Systems and Organizations, the results of a NIST-GSA-University of Maryland study (Sandor Boyson, Technovation), SAFECode supply chain guidance, the Build Security In Maturity Model (BSIMM), and a variety of other articles, blog posts, and documents in the public domain.

Much like the publications it is derived from, the compilation is intended to be used as a catalog of practices that is tailored by the user based on the particular circumstances of the supply chain that is being managed and which phase of the procurement lifecycle the practices are being used in.

The starting point is to identify which of the various practices in the document are best suited to your supply chain. For example, if you’re purchasing hardware, chain of custody and traceability practices are probably more important than they would be for a software purchase, and for software, secure development life cycle practices are probably more important than traceability practices.

The next steps are to incorporate the selected practices into your supply chain management processes, from onboarding to performance to closeout.

Read more A blueprint for cyber supply chain risk management

If you have opinions, please write to use in the comment box below. Subscribe to us for more updates.

The Role of Business Intelligence in the Supply Chain

Supply Chain BI Dashboard - Warehouse Order Performance

Supply Chain BI Dashboard – Warehouse Order Performance

Business intelligence enhances supply chain management by making real-time data analytics accessible. Self-service BI takes this a step further by allowing users to run their own queries and create their own reports, even if they don’t have a background in statistical analysis.

Here, we’ll discuss how BI can provide real-time insights into supply chain emerging risks, inefficiencies, and anomalies, allowing organizations to quickly isolate and resolve potential problems.

Supply Chain Disruptions

We saw unprecedented disruption to supply chains in 2020 that caused problems for companies and consumers. The Federal Reserve reports continued supply chain and logistics disruptions in 2021 are emerging at the same time demand is increasing.

For companies struggling to manage supply chains, it’s a significant issue. Supply chains represent as much as half of the value of a company’s products or services.

Failing to manage the supply chain efficiently, leads to ongoing problems, including:

  1. Less resilient to market changes
  2. Less efficient
  3. Decreased inventory
  4. Inability to meet demand
  5. Decreased financial performance

Managing the Supply Chain with Embedded BI

Embedded BI integrates business intelligence reporting tools into everyday apps. Embedded business intelligence tools provide ad hoc reporting, interactive dashboards, scheduling, and distribution tools within your custom apps.

When you embed business intelligence tools into your decision chain, it provides quick access to the insights team members need. Potential supply chain problems can be spotted in real-time for faster resolution.

Visualizing Demand and Inventory

Data visualization makes it easier to manage inventory by providing a visual reference for current inventory levels and pending orders. This makes it easier to forecast inventory needs and set reorder points.

Visualizing Distribution

You can also visualize the movement of goods and material through your supply chain into your inventory and out the door to customers. By monitoring order status, you can also see potential disruptions in your supply chain or your processes.

Read more at The Role of Business Intelligence in the Supply Chain.

Leave your comments below and subscribe to us for new updates.

Healthcare Financial Trends for 2022

The trajectory of the COVID-19 crisis suggests a long-tailed recovery. The latest financial data reveals the ongoing challenges.

The trajectory of the COVID-19 crisis suggests a long-tailed recovery. The latest financial data reveals the ongoing challenges.

COVID-19 continues to dominate the headlines, and its massive influence on healthcare will extend throughout 2022. At the same time, longstanding issues demand attention. CommerceHealthcare® recently completed its annual market scan and analysis of leading issues in finance and revenue cycle management (RCM). Healthcare Finance Trends for 2022 detail eleven trends that carry significant implications for the economic and operational wellbeing of health systems, hospitals, and physician practices.

Another Year of Financial Recovery

The trajectory of the COVID-19 crisis suggests a long-tailed recovery. The latest financial data reveals the ongoing challenges.

  1. Margin/Profitability. More than a third of hospitals maintained negative operating margins during 2021. Estimated total industry net income loss was $54 billion and median margin 11% below pre-pandemic levels. Hospitals paid an additional $24 billion for clinical labor during the year, $17 million for the average 500-bed hospital. Medical practices have suffered as well. Under 30% of surveyed primary care practices reported being financially healthy.
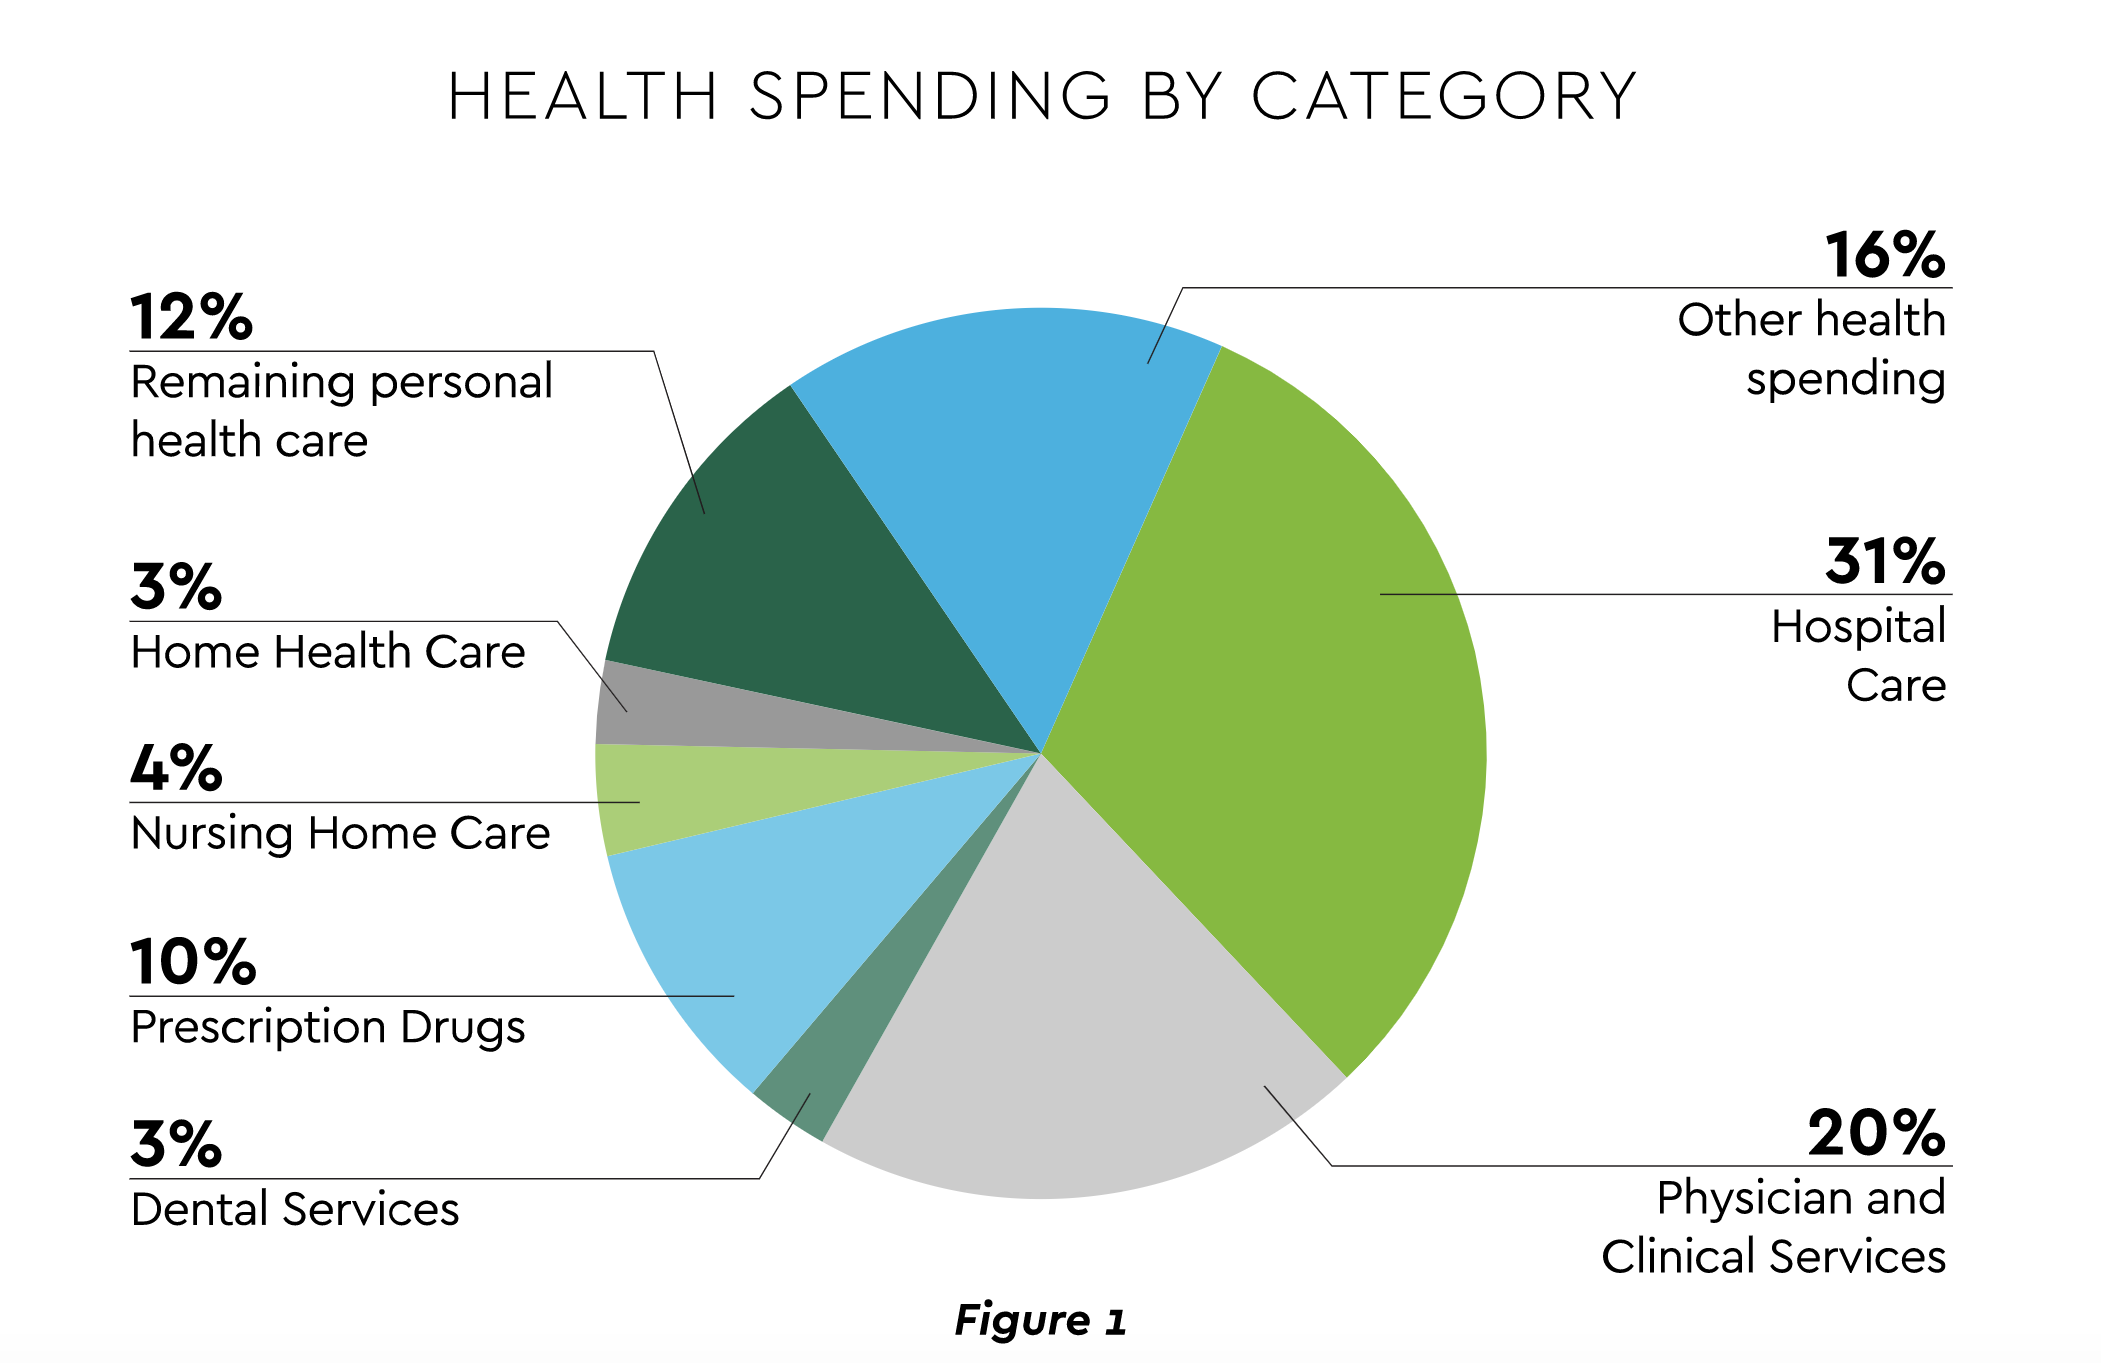
  2. Revenue and Volume. An encouraging but decidedly mixed picture emerges on the demand side. Through August 2021, overall healthcare spending was 7.2% higher than the previous year, distributed as displayed in Figure 1. Spending has lagged GDP growth. Hospital revenue grew, but volume of overall discharges and emergency department (ED) visits remains depressed from 2019 and flat for OR minutes. The longer-term utilization outlook sees inpatient volume decreasing 1% through the end of the decade, outpatient rising 14% and ED growing 5% for emergent and falling 15% for urgent.
  3. Cash/Liquidity. This metric was bolstered by COVID-19 government subsidies and expedited insurance reimbursements. Disciplined cash management will be required as these supports are removed. In fact, a recent article detailed an emerging liquidity challenge. Major insurers are behind on billions of dollars in payments for various reasons.7
  4. Medical Cost Trend. Another closely watched indicator is growth in employer medical costs. Forecasts for 2022 include:
    1. PwC: 6.5%8
    2. Willis Towers: 5.2%9
    3. Aon: 4.8%10
Health spending by category

Health spending by category

Subscribe to us for more updates. Leave your comments below if you have opinions.

Read more at Healthcare Financial Trends for 2022

Disruptions in China can lead to ‘ripple-effects’ across global supply chain, says HSBC

Disruptions in China can lead to ‘ripple-effects’ across global supply chain, says HSBC

Disruptions in China can lead to ‘ripple-effects’ across global supply chain, says HSBC

China’s zero-Covid restrictions will impact global supply chain recovery as any small disruption in the country will likely lead to “ripple effects” across the world, according to the head of shipping at HSBC. The pandemic has revealed “how lean the supply chain has become. And there is little margin of error,” said Parash Jain, global head of shipping and ports equity research at HSBC.

“The sheer importance of China when it comes to global trade means that any small disruption in China, will have a ripple effect across the supply chain,” Jain told CNBC’s “Squawk Box Asia” on Monday. China, the world’s second largest economy, has doubled down on its zero-Covid strategy due to recent spikes in infections across the country. Covid cases have been reported in the key port cities of Shenzhen, Tianjin and Ningbo, as well as the industrial hub of Xi’an, resulting in lockdowns and curbs in the largest port hubs.

China reported 58 new Covid-19 cases as of Monday, according to the national health authority. The National Health Commission in its daily update said 40 of the new cases were local infections, with the remaining 18 coming from overseas. Despite having a relatively low number of cases compared to many other places in Asia, Beijing has clung onto its zero-Covid approach. China has a 7-day rolling average of 0.04 daily cases per million people as of Jan. 30 compared with 568.8 for Japan, 290.41 for South Korea and 180.35 for India, according to Our World in Data.

China has the infrastructure in place to quickly decongest — whether it’s at the port or in the supply chain side, said Jain. “However, the chaos created because of this will eventually have an impact on the other side of the ocean,” he added. “That’s why, as long as China maintains this very strict zero-Covid stance, we cannot rule out a disruption time to time as the year progress,” he added.

Read more at Disruptions in China can lead to ‘ripple-effects’ across global supply chain, says HSBC

Share your opinion with us in the comment box and subscribe us to get the latest updates.