Inventory Analysis: Affordable, Available, Actionable

Inventory Analysis: Affordable, Available, Actionable

For any manufacturer or distributor, the problem with inventory management is easily stated. Simply put, there’s often too much of the stuff that isn’t selling—and far too little of the stuff that is selling.

The result? Disappointed customers, stock-outs and lost sales—combined with shelves groaning with inventory that nobody wants.

Put like that, the mismatch sounds almost comic. But to companies wrestling with just this problem, it’s a quandary that’s very real, and far from laughable.

For in today’s business climate, lost sales and disappointed would-be customers can be very bad news indeed. What’s more, the financial drain of financing unwanted inventory can be crippling. Because while banks are admittedly more willing to lend than they were at the height of the financial crisis, borrowing limits are tight, and terms are expensive.

So what’s to be done?

Inventory analysis: cheaper than ERP, easier than best-of-breed.

Fancy inventory optimization algorithms can help, of course. So can advanced forecasting techniques.
The latter help you to more accurately predict the customer demand that you’ll face; the former help you to better meet those customer demands with available stock.

Inventory analysis: under control, faster and cheaper.

Which is why, of course, so many manufacturers and distributors—especially those with elderly or partially-implemented ERP systems—try the ‘sticking plaster’ approach of spreadsheet-based analysis.

Inventory analysis: self-financing actionable insights.

At Matillion, we know that most of our customers come to us wanting a low-cost, effective Cloud BI solution that can be implemented quickly. And usually, financial reporting and analysis is fairly high on their agendas.

Do you like this article? Share this article if you like and if you have any opinions, leave us comments below or send us a message.

Five factors of supply chain sustainability

The five factors of supply chain sustainability

Leadership, empowerment and sharing success stories are among the attributes required to implement sustainable procurement.

That’s according to a panel of experts who shared their top tips at the Institute for Supply Management annual conference in Las Vegas, US last week. The advice included:

  1. Sustainability champions : “Find out who’s passionate about this in your organisation and ask them to be champions.”
  2. Leadership : “You are all leaders to your supply chain, they’re looking to you and your actions and expectations.”
  3. Empowerment : “If you give people a ladder to execute in their own fashion they will take ownership of it.”
  4. Success : “Nothing sells better than success, so we recognise and reward success.”
  5. Metrics : “If you can communicate what you [have done], it is really a powerful story.”

Do you have any opinions? Leave your comments below or send us a message.

New Business Performance Management Solution from InsightSoftware.com Offers One System for Optimal Visibility

New Business Performance Management Solution from InsightSoftware.com Offers One System for Optimal Visibility

InsightSoftware.com, a leading provider of reporting, budgeting and reconciliation solutions for Oracle E-Business Suite and JD Edwards, today unveiled three new products designed to empower business users with the information they need to directly impact business performance, while also helping them realize a new level of value from their existing enterprise software systems. The products, announced today at COLLABORATE 2014, include two new additions to the award-winning InsightUnlimited product suite – InsightUnlimited Planning and InsightUnlimited Reporting for PeopleSoft – and a new business performance management solution called Hubble.

“New technology does not always equal business gain. Our goal with these new solutions is to help users gain a new level of value, not only from the data in their ERP, but also from their existing software solutions,” said Paul Yarwood, General Manager for InsightSoftware.com. “Data and technology is meant to empower – not slow you down. Hubble and our expanded InsightUnlimited solutions empower users with their information and their software so they can do their jobs better and directly impact business performance.”

With Hubble’s complete visibility, users can collaborate across multiple departments and through various levels of detail. Hubble also allows users to:

  1. Connect finance data from multiple sources into a single consolidated view;
  2. Easily search for metrics, discussions, workspaces and even people;
  3. Create an intuitive layer of organization, without the burden of traditional file structures, using innovative tagging capabilities;
  4. Share data with people inside and outside the organization without having to worry about permissions and privileges; and
  5. Make data powerful with infographic-style metrics that define goals and highlight important corporate milestones.

Thank you for reading, feel free to leave a comment if you have any opinions or send us a message.

FusionOps Unveils LiveAnalytics for Supply Chain Data

FusionOps Unveils LiveAnalytics for Supply Chain Data

FusionOps, a supply chain analytics company that provides a cloud-based business intelligence (BI) application, has launched LiveAnalytics for supply chain data. LiveAnalytics uses images and live metrics to create infographics for supply chain processes and workflows.

The FusionOps application allows businesses to create new analytics from scratch. In addition, the application offers thousands of configurable analytics, metrics and tickers, FusionOps said.

LiveAnalytics leverages FusionOps’ interactive, root-cause analysis across the supply chain. FusionOps said LiveAnalytics users can visualize changes in their supply chains in real-time and evaluate data from all functional areas to become more efficient.

Some of LiveAnalytics’ features include:

  1. Alerts – When alerts are triggered, users are notified via email about supply chain events in real-time.
  2. Key performance indicator (KPI) dictionary – The new KPI dictionary explains pre-built and company-specific metrics.
  3. Personalized navigation – Users can access thousands of dashboards, KPIs and reports directly from LiveAnalytics’ main navigation and “Favorites” menus.

Thanks for reading this article. Welcome to leave a comment below or send us a message if you have any opinions.


Sharpening strategic risk management

Sharpening strategic risk management

While conventional enterprise risk management (ERM) techniques have done a reasonable job in identifying and mitigating financial and operational risks, research shows that it is the management of strategic risk factors that will have the greatest impact on your ability to realise your strategic objectives. Bringing ERM into the forefront of strategic decision making and execution could thus give your business a decisive edge.

Strategic risks can be defined as the uncertainties and untapped opportunities embedded in your strategic intent and how well they are executed. As such, they are key matters for the board and impinge on the whole business, rather than just an isolated unit.

Strategic risk management is your organisation’s response to these uncertainties and opportunities. It involves a clear understanding of corporate strategy, the risks in adopting it and the risks in executing it. These risks may be triggered from inside or outside your organisation. Once they are understood, you can develop effective, integrated, strategic risk mitigation.

Far from holding back the business, strategic risk management is about augmenting strategic management and getting the full value from your strategy. In a typical instance, a conventional approach to setting and executing strategy might look at sales growth and service delivery. Rarely does it monitor the risks of a shortfall in demand.

Key questions for the board

  1. How well is my strategy actually defined?
  2. How broad are the risks that we are considering?
  3. What risk scenarios have we considered to test our plans?
  4. Have we mapped our risks to key performance and value measures?

Thank you for reading. If you have any opinions, please leave a comment below or send us a message.

Part-Time Entrepreneurs Need to Be Empowered

Part-Time Entrepreneurs Need to Be Empowered

According to Industry Canada, survival rates for small and medium-sized businesses decline over time. About 85 per cent of businesses that enter the marketplace survive for one full year yet only 51 per cent survive for five years.

Yet, with commitment and passion, many have successfully made the transition from part-time start-up to full-time career.

The Intuit survey found that about one third (35 per cent) of start-ups trying to go full-time would quit their jobs if they could pull in a mere $30,000 or less. Depending on your financial goals, taking your business full-time could be closer than you think.

Are you ready to make your dream a full-time career? Here are some tips to help you take it to the next level:

  1. Define a goal and build on it
  2. Continue to innovate
  3. Brush up on your financial literacy
  4. Make your network work for you
  5. Take advantage of free services

Share your thoughts about this by leaving comments below or feel free to send us a message.

A Harvest of Company Details, All in One Basket

A Harvest of Company Details, All in One Basket

Trolling government records for juicy details about companies and their executives can be a ponderous task. I often find myself querying the websites of multiple federal agencies, each using its own particular terminology and data forms, just for a glimpse of one company’s business.

But a few new services aim to reduce that friction not just for reporters, but also for investors and companies that might use the information in making business decisions. One site, rankandfiled.com, is designed to make company filings with the Securities and Exchange Commission more intelligible. It also offers visitors an instant snapshot of industry relationships, in a multicolored “influence” graph that charts the various companies in which a business’s officers and directors own shares. According to the site, pooh-bahs at Google, for example, have held shares in Apple, Netflix, LinkedIn, Zynga, Cisco, Amazon and Pixar.

Another site, Enigma.io, has obtained, standardized and collated thousands of data sets — including information on companies’ lobbying activities and their contributions to state election campaigns — made public by federal and state agencies. Starting this weekend, the public will be able to use it, at no charge, to seek information about a single company across dozens of government sources at once.

Welcome to leave any comment below or send us a message

The Startup Entrepreneur’s Guide To Risk Management

The Startup Entrepreneur’s Guide To Risk Management

Only 44% of small businesses stick around four years or more. One big reason so many go away: Poor risk management.

Fortunately, help is on the way from the guys at VC Experts (subscribe to their email here).

They’ve published a helpful how-to on the art of risk management from Akira Hirai, the founder and managing director of Cayenne Consulting. With permission, we’ve excerpted the best bits below.

The Risk Management Framework

“Risk Management” is the art and science of thinking about what could go wrong, and what should be done to mitigate those risks in a cost-effective manner.

In order to identify risks and figure out how best to mitigate them, we first need a framework for classifying risks.

Once we know the severity and likelihood of a given risk, we can answer the question: Does the benefit of mitigating a risk outweigh the cost of doing so?

  1. Quadrant A: Ignorable Risks
  2. Quadrant B: Nuisance Risks
  3. Quadrant C: Insurable Risks
  4. Quadrant D: The Company Killers

Identifying & Mitigating the Company Killers

Companies flatline when the cash runs out and total current liabilities (i.e., bills due now) exceed total liquid assets. Risk management is all about identifying and mitigating the uncertainties — especially the company killers — that surround cash flows.

Uncertainty plagues businesses in countless ways, but we can group most company killers into the following categories:

  1. Market Risks
  2. Competitive Risks
  3. Technology & Operational Risks
  4. Financial Risks
  5. People Risks
  6. Legal & Regulatory Risks
  7. Systemic Risks

The knowledge of risk management is also essential establishing a startup business. If you have any opinion, leave it in the comment box below or send us a message.

Is ETL Development doomed?

Is ETL Development doomed?

There seems to be a couple of tracks for this. First is the pure development automation tools, such as Varigence MIST. If you are technically minded, take a look at this product demo video – though I suggest skipping to about 25 minutes in to see the real meat as it does go on a bit. It looks mindbogglingly powerful but is clearly shooting at the ETL pro who wants to churn stuff out faster, more consistently and with less fiddling about. MIST is limited to SSIS/AS (for now) and I’m not sure how far it will go as it’s clearly aimed at the developer pro market, which is not always the big buyers. I expect to be playing with it more over the next few weeks on a live project so should be able to get a better view.

The second path appears to be more targeted at eliminating ETL developers in their entirety. AnalytixDS wraps up metadata import (i.e. you suck in your source and target metadata from the systems or ERWIN), do the mapping of fields and apply rules, then “push button make code”. Obviously there’s a bit more to it than that, but the less you care about your back end and the quality of your ETL code (cough Wherescape cough) the more likely this product will appeal to you. Say hello, business users, who are the big buyers (though I look forward to troubleshooting your non-scalable disasters in the near future).

Do you have any opinion? Share with us by leaving your comments below of send us a message.

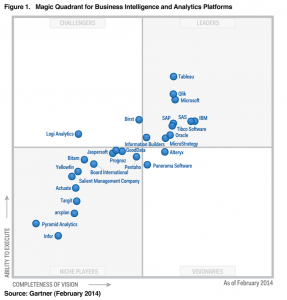
Magic Quadrant for Business Intelligence and Analytics Platforms

Magic Quadrant for Business Intelligence and Analytics Platforms

Magic Quadrant for Business Intelligence and Analytics Platforms

 Magic Quadrant for Business Intelligence and Analytics Platforms

Data discovery capabilities are dominating new purchasing  requirements, even for larger deployments, as alternatives to traditional BI tools. But “governed data discovery” — the ability to meet the dual demands of enterprise IT and business users — remains a challenge unmet by any one vendor.

The BI and analytics platform market is in the middle of an accelerated transformation from BI systems used primarily for measurement and reporting to those that also support analysis, prediction, forecasting and optimization. Because of the growing importance of advanced analytics for descriptive, prescriptive and predictive modeling, forecasting, simulation and optimization (see “Extend Your Portfolio of Analytics Capabilities”) in the BI and information management applications and infrastructure that companies are building — often with different buyers driving purchasing and different vendors offering solutions — this year Gartner has also published a Magic Quadrant exclusively on predictive and prescriptive analytics platforms (see Note 1). Vendors offering both sets of capabilities are featured in both Magic Quadrants.

For this Magic Quadrant, Gartner defines BI and analytics as a software platform that delivers 17 capabilities across three categories: information delivery, analysis and integration.

As a result of the market dynamics discussed above, the capability definitions in this year’s Magic Quadrant have been modified with the following additions and subtractions to reflect our current view of critical capabilities for BI and analytics platforms.
Capabilities dropped:

  1. Scorecard: Most companies do not implement true scorecard/strategy maps using BI platforms — they implement dashboards. Also, most BI vendors report limited sales activity for their scorecard products. Scorecards are primarily delivered by corporate performance management (CPM) vendors (see “Strategic CPM as a Driver for Organizational Performance Management”). Therefore, we have included scorecards as a type of dashboard, rather than as a separate category.
  2. Predictive Analytics: covered in the new “Magic Quadrant for Advanced Analytics Platforms.”
  3. Prescriptive Analytics: covered in the new “Magic Quadrant for Advanced Analytics Platforms.”

Capabilities added:

  1. Geospatial and location intelligence (see the Analysis section)
  2. Embedded advanced analytics (see the Analysis section)
  3. Business user data mashup and modeling (see the Integration section)
  4. Embeddable analytics (see the Integration section)
  5. Support for big data sources (see the Integration section)

Feel free to leave us your comments or send us a message.