10 Ways Machine Learning Is Revolutionizing Supply Chain Management

Machine learning makes it possible to discover patterns in supply chain data by relying on algorithms that quickly pinpoint the most influential factors to a supply networks’ success, while constantly learning in the process.

Discovering new patterns in supply chain data has the potential to revolutionize any business. Machine learning algorithms are finding these new patterns in supply chain data daily, without needing manual intervention or the definition of taxonomy to guide the analysis. The algorithms iteratively query data with many using constraint-based modeling to find the core set of factors with the greatest predictive accuracy. Key factors influencing inventory levels, supplier quality, demand forecasting, procure-to-pay, order-to-cash, production planning, transportation management and more are becoming known for the first time. New knowledge and insights from machine learning are revolutionizing supply chain management as a result.

The ten ways machine learning is revolutionizing supply chain management include:

  1. Machine learning algorithms and the apps running them are capable of analyzing large, diverse data sets fast, improving demand forecasting accuracy.
  2. Reducing freight costs, improving supplier delivery performance, and minimizing supplier risk are three of the many benefits machine learning is providing in collaborative supply chain networks.
  3. Machine Learning and its core constructs are ideally suited for providing insights into improving supply chain management performance not available from previous technologies.
  4. Machine learning excels at visual pattern recognition, opening up many potential applications in physical inspection and maintenance of physical assets across an entire supply chain network.
  5. Gaining greater contextual intelligence using machine learning combined with related technologies across supply chain operations translates into lower inventory and operations costs and quicker response times to customers.
  6. Forecasting demand for new products including the causal factors that most drive new sales is an area machine learning is being applied to today with strong results.
  7. Companies are extending the life of key supply chain assets including machinery, engines, transportation and warehouse equipment by finding new patterns in usage data collected via IoT sensors.
  8. Improving supplier quality management and compliance by finding patterns in suppliers’ quality levels and creating track-and-trace data hierarchies for each supplier, unassisted.
  9. Machine learning is improving production planning and factory scheduling accuracy by taking into account multiple constraints and optimizing for each.
  10. Combining machine learning with advanced analytics, IoT sensors, and real-time monitoring is providing end-to-end visibility across many supply chains for the first time.

Read more at 10 Ways Machine Learning Is Revolutionizing Supply Chain Management

If you find this article interesting, consider sharing it with your network, and share your opinions with us in the comment box.

Supply chains in need of greater costing accuracy, study reveals

Costing accuracy within supply chains must improve, a study by APICS and IMA has revealed.

The results of a survey found that supply chain managers agreed, on average, that the benefits of improving their costing systems exceed the investment.

When asked what prevents them from utilising current costing information, 44% of supply chain managers cited a lack of operational data. Instead, costing information is often reported in exclusively financial terms, making it more difficult to leverage.

According to respondents, the secondary and tertiary barriers to useful costing information are inadequate technology and software (39%) and a resistance to change by accounting and finance personnel (30%).

According to the report, there are three root causes of why supply chain professionals are not receiving adequate costing information:

An overreliance on external financial reporting systems:

Many organisations rely on externally-oriented financial accounting systems that employ oversimplified methods of costing products and services to produce information supporting internal business decision making.

Using outdated costing models:

Traditional cost accounting practices can no longer meet the challenges of today’s business environment, but are still used by many accountants.

Accounting and finance’s resistance to change:

With little pressure from managers who use accounting information to improve data accuracy and relevance, accountants are reluctant to promote new, more appropriate practices within their organisations.

The report details various steps supply chain professionals can take to improve costing systems within their organisations.

One strategy presented is for supply chain managers to strengthen their relationship with accounting and finance to foster greater information flow between the two departments.

Read more at Supply chains in need of greater costing accuracy, study reveals

Subscribe us to get more updates in your inbox, and leave your comments below.

Asda and Co-op to work together to drive supply chain efficiencies

Asda and the Co-op are pioneering a new way of supply chain collaboration, by enabling mutual suppliers to submit aggregated data on waste, water and energy to both retailers at the same time.

The retailers are working with collaboration platform 2degrees to collect the sustainability data.

Under the agreement, suppliers who serve both retailers can submit the data once, indicating their combined data should be shared with both customers.

It is hoped that by eliminating the need for duplicated information, suppliers will be able to spend more time focussing on the delivery of quality products whilst saving on time, money and resources.

Both retailers have seen suppliers benefit from the platforms delivered by 2degrees. The Co-op, one of the founding partners of multi-client platform Manufacture 2030 has already seen a drinks supplier start addressing their carbon footprint through the platform.

Andy Horrocks of Kingsland Drinks, said: “We are looking closely at a case study shared by another drinks supplier on Manufacture 2030, and using it as a model of how this key environmental process could be done, helping us to sell the idea internally.”

Princes Limited is a key supplier to both Asda and Co-op, and has spoken of the benefits of aligned data.

David McDiarmid, Corporate Relations Director at Princes Ltd, commented: “It’s great that two retailers like Co-op and Asda have embraced this approach. With all our manufacturing locations sharing their data between these customers we have cut down duplicated effort, saving time and making the entire process a lot more efficient.

“I hope other retailers will see the benefits of such a collaborative approach and consider it for their suppliers environmental reporting.”

Read more at Asda and Co-op to work together to drive supply chain efficiencies

What have you learnt from this article? Share your thoughts with us in the comment box and subscribe to get updates.

IBM Datapalooza Takes Aim At Data Scientist Shortage

IBM announced in June that it has embarked on a quest to create a million new data scientists. It will be adding about 230 of them during its Datapalooza educational event this week in San Francisco, where prospective data scientists are building their first analytics apps.

Next year, it will take its show on the road to a dozen cities around the world, including Berlin, Prague, and Tokyo.

The prospects who signed up for the three-day Datapalooza convened Nov. 11 at Galvanize, the high-tech collaboration space in the South of Market neighborhood, to attend instructional sessions, listen to data startup entrepreneurs, and use workspaces with access to IBM’s newly launched Data Science Workbench and Bluemix cloud services. Bluemix gives them access to Spark, Hadoop, IBM Analytics, and IBM Streams.

Rob Thomas, vice president of product development, IBM Analytics, said the San Francisco event is a test drive for IBM’s 2016 Datapalooza events. “We’re trying to see what works and what doesn’t before going out on the road.”

Thomas said Datapalooza attendees were building out DNA analysis systems, public sentiment analysis systems, and other big data apps.

Read more at IBM Datapalooza Takes Aim At Data Scientist Shortage

Share your opinions in the comment box and subscribe us to get more updates in your inbox.

How can Lean Six Sigma help Machine Learning?

Note that this article was submitted and accepted by KDnuggest, the most popular blog site about machine learning and knowledge discovery.

I have been using Lean Six Sigma (LSS) to improve business processes for the past 10+ year and am very satisfied with its benefits. Recently, I’ve been working with a consulting firm and a software vendor to implement a machine learning (ML) model to predict remaining useful life (RUL) of service parts. The result which I feel most frustrated is the low accuracy of the resulting model. As shown below, if people measure the deviation as the absolute difference between the actual part life and the predicted one, the resulting model has 127, 60, and 36 days of average deviation for the selected 3 parts. I could not understand why the deviations are so large with machine learning.

After working with the consultants and data scientists, it appears that they can improve the deviation only by 10%. This puzzles me a lot. I thought machine learning is a great new tool to make forecast simple and quick, but I did not expect it could have such large deviation. To me, such deviation, even after the 10% improvement, still renders the forecast useless to the business owners.

Read more at How can Lean Six Sigma help Machine Learning?

Leave your comments below and subscribe us to get updates in your inbox.

Great Suppliers Make Great Supply Chains

As an analyst who covers supply chain management (SCM) and procurement practice across industry, I tend to keep my keyboard focused on the disruptive themes that continue to re-define it. That said, if you’re expecting me go on about the unprecedented growth of the SCM solution markets, the accelerated pace of innovation, tech adoption, social change, etc., don’t hold your breath. I can’t, as the data argue otherwise. Too many of us conflate diversification with acceleration –and there’s a difference.

The most notable, defining advances of the last decade (Amazon, Twitter, Google, etc.) share something in common: they do not require consumer investment. If you take those monsters out of the equation and focus on corporate solution environments, the progress, while steady, has not been remarkable. Let’s just say there remains plenty of room for improvement, especially in supply chain and procurement practice areas.

I fell onto this tangent unexpectedly. It happened while interviewing Mr. Dan Georgescu, Ford Motor Company, adjunct Professor of Operations and Supply Chain Management, a highly regarded expert in the field of automotive industry supplier development. “For supply chains to be successful, performance measurement must become a continuous improvement process integrated throughout,” he said. “For a number of reasons, including the fact that our industry is increasingly less vertically integrated, supplier development is absolutely core to OEM performance.”

Read more at Great Suppliers Make Great Supply Chains

If you have any comments about this topic, share it with us below. Subscribe to get updates in your inbox.

One-Page Data Warehouse Development Steps

Data warehouse is the basis of Business Intelligence (BI). It not only provides the data storage of your production data but also provides the basis of the business intelligence you need. Almost all of the books today have very elaborated and detailed steps to develop a data warehouse. However, none of them is able to address the steps in a single page. Here, based on my experience in data warehouse and BI, I summarize these steps in a page. These steps give you a clear road map and a very easy plan to follow to develop your data warehouse.

Step 1. De-Normalization. Extract an area of your production data into a “staging” table containing all data you need for future reporting and analytics. This step includes the standard ETL (extraction, transformation, and loading) process.

Step 2. Normalization. Normalize the staging table into “dimension” and “fact” tables. The data in the staging table can be disposed after this step. The resulting “dimension” and “fact” tables would form the basis of the “star” schema in your data warehouse. These data would support your basic reporting and analytics.

Step 3. Aggregation. Aggregate the fact tables into advanced fact tables with statistics and summarized data for advanced reporting and analytics. The data in the basic fact table can then be purged, if they are older than a year.

Read more at One-Page Data Warehouse Development Steps

What do you think about this topic? Share your opinions below and subscribe us to get updates in your inbox.


The Bank of England has a chart that shows whether a robot will take your job

robot jobs

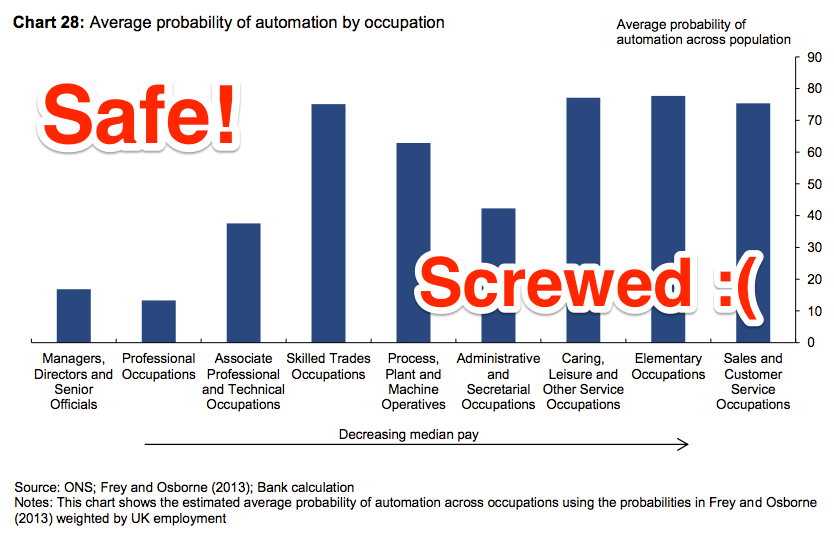
The threat is real, as this chart showing the rise and fall of various jobs historically shows. Agricultural workers were replaced largely by machinery decades ago. Telephonists have only recently been replaced by software programmes. This looks like good news for accountants and hairdressers. Their unique skills are either enhanced by software (accountants) or not affected by it at all (hairdressers).

The BBC website contains a handy algorithm for calculating the probability of your job being robotised. For an accountant, the probability of vocational extinction is a whopping 95%. For a hairdresser, it is 33%. On these numbers, the accountant’s sun has truly set, but the relentless upwards ascent of the hairdresser is set to continue. For economists, like me, the magic number is 15%.

Another data analysis about jobs which will be phased out as time goes. It is an interesting analysis of historical job data. However, after I glanced through the bank report referenced in the article, I am not sure robots are the reason of the job replacement. For example, it could be replaced by cheap labor in foreign countries. The bank report shows only the jobs subject to be phased out due to technology advancement. People could just become productive. So, do not take robots too seriously!

Read more at The Bank of England has a chart that shows whether a robot will take your job

What do you think about this article? Share you opinions in the comment box and subscribe us to get updates.

Big data analytics technology: disruptive and important?

Of all the disruptive technologies we track, big data analytics is the biggest. It’s also among the haziest in terms of what it really means to supply chain. In fact, its importance seems more to reflect the assumed convergence of trends for massively increasing amounts of data and ever faster analytical methods for crunching that data. In other words, the 81percent of all supply chain executives surveyed who say big data analytics is ‘disruptive and important’ are likely just assuming it’s big rather than knowing first-hand.

Does this mean we’re all being fooled? Not at all. In fact, the analogy of eating an elephant is probably fair since there are at least two things we can count on: we can’t swallow it all in one bite, and no matter where we start, we’ll be eating for a long time.

So, dig in!

Getting better at everything

Searching SCM World’s content library for ‘big data analytics’ turns up more than 1,200 citations. The first screen alone includes examples for spend analytics, customer service performance, manufacturing variability, logistics optimisation, consumer demand forecasting and supply chain risk management.

Read more at Big data analytics technology: disruptive and important?

Share your opinions regarding this topic in the comment box below and subscribe us for more updates.

Data Lake vs Data Warehouse: Key Differences

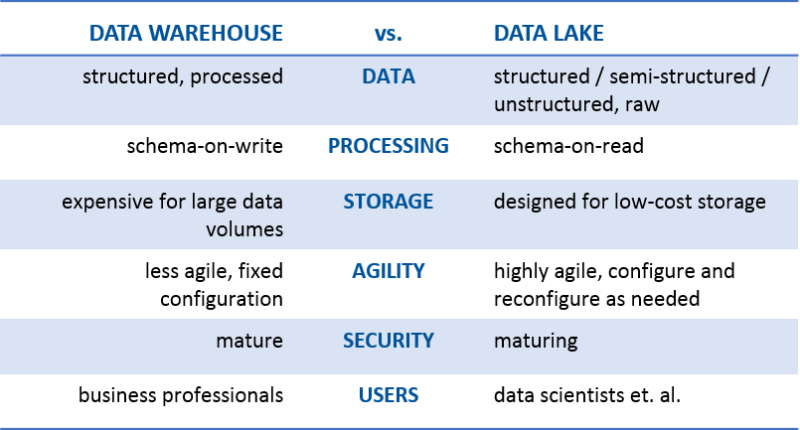
Some of us have been hearing more about the data lake, especially during the last six months. There are those that tell us the data lake is just a reincarnation of the data warehouse—in the spirit of “been there, done that.” Others have focused on how much better this “shiny, new” data lake is, while others are standing on the shoreline screaming, “Don’t go in! It’s not a lake—it’s a swamp!”

All kidding aside, the commonality I see between the two is that they are both data storage repositories. That’s it. But I’m getting ahead of myself. Let’s first define data lake to make sure we’re all on the same page. James Dixon, the founder and CTO of Pentaho, has been credited with coming up with the term. This is how he describes a data lake:

“If you think of a datamart as a store of bottled water – cleansed and packaged and structured for easy consumption – the data lake is a large body of water in a more natural state. The contents of the data lake stream in from a source to fill the lake, and various users of the lake can come to examine, dive in, or take samples.”

And earlier this year, my colleague, Anne Buff, and I participated in an online debate about the data lake. My rally cry was #GOdatalakeGO, while Anne insisted on #NOdatalakeNO. Here’s the definition we used during our debate:

“A data lake is a storage repository that holds a vast amount of raw data in its native format, including structured, semi-structured, and unstructured data. The data structure and requirements are not defined until the data is needed.”

Read more Data Lake vs Data Warehouse: Key Differences

What do you think about this topic? Share your opinions below and subscribe us to get updates in your inbox.